RSA3015N - Measuring equipment Rigol - Free user manual and instructions
Find the device manual for free RSA3015N Rigol in PDF.


| Product Type | Spectrum Analyzer |
| Brand | Rigol |
| Model | RSA3015N |
| Frequency Range | 9 kHz to 1.5 GHz |
| Displayed Average Noise Level (DANL) | -161 dBm/Hz (typical) |
| Resolution Bandwidth (RBW) | 1 Hz to 3 MHz |
| Phase Noise | -95 dBc/Hz @ 10 kHz offset (1 GHz carrier) |
| Amplitude Measurement Range | DANL to +30 dBm |
| Input Impedance | 50 Ω |
| Screen | 10.1-inch color TFT touchscreen, 1024×600 pixels |
| Interface | USB, LAN, GPIB (optional), HDMI |
| Weight | Approximately 4.2 kg |
| Dimensions (W×H×D) | 350 × 188 × 122 mm |
| Power Supply | 100-240V AC, 50/60Hz, <55W |
| Measurement Functions | Spectrum analysis, channel power, occupied bandwidth, harmonic distortion, TOI, ACPR, spectrogram |
| Trigger Modes | Free run, video, external, power |
| Data Storage | Internal memory (up to 1000 traces), USB drive support |
| Cleaning | Wipe exterior with dry, lint-free cloth; avoid liquids |
| Safety | Overvoltage protection, max input +30 dBm, ESD precautions recommended |
| Spare Parts & Repairability | Contact Rigol service center for parts; user-replaceable fuse |
Frequently Asked Questions - RSA3015N Rigol
User questions about RSA3015N Rigol
0 question about this device. Answer the ones you know or ask your own.
Ask a new question about this device
Download the instructions for your Measuring equipment in PDF format for free! Find your manual RSA3015N - Rigol and take your electronic device back in hand. On this page are published all the documents necessary for the use of your device. RSA3015N by Rigol.
USER MANUAL RSA3015N Rigol
RSA3000 Series Real-time Spectrum Analyzer
Sept. 30, 2018
RIGOL TECHNOLOGIES CO., LTD.
Guaranty and Declaration
Copyright
© 2020 RIGOL TECHNOLOGIES CO., LTD. All Rights Reserved.
Trademark Information
RIGOL® is the trademark of RIGOL TECHNOLOGIES CO., LTD.
Publication Number
UGD21102-1110
Software Version
00.01.00
Software upgrade might change or add product features. Please acquire the latest version of the manual from RIGOL website or contact RIGOL to upgrade the software.
Notices
● RIGOL products are covered by P.R.C. and foreign patents, issued and pending.
- RIGOL reserves the right to modify or change parts of or all the specifications and pricing policies at the company's sole decision.
● Information in this publication replaces all previously released materials.
● Information in this publication is subject to change without notice.
- RIGOL shall not be liable for either incidental or consequential losses in connection with the furnishing, use, or performance of this manual, as well as any information contained.
- Any part of this document is forbidden to be copied, photocopied, or rearranged without prior written approval of RIGOL.
Product Certification
RIGOL guarantees that this product conforms to the national and industrial standards in China as well as the ISO9001:2015 standard and the ISO14001:2015 standard. Other international standard conformance certifications are in progress.
Contact Us
If you have any problem or requirement when using our products or this manual, please contact RIGOL.
E-mail: service@rigol.com
Website: www.rigol.com
Safety Requirement
General Safety Summary
Please review the following safety precautions carefully before putting the instrument into operation so as to avoid any personal injury or damage to the instrument and any product connected to it. To prevent potential hazards, please follow the instructions specified in this manual to use the instrument properly.
Use Proper Power Cord.
Only the exclusive power cord designed for the instrument and authorized for use within the local country could be used.
Ground the Instrument.
The instrument is grounded through the Protective Earth lead of the power cord. To avoid electric shock, connect the earth terminal of the power cord to the Protective Earth terminal before connecting any input or output terminals.
Connect the Probe Correctly.
If a probe is used, the probe ground lead must be connected to earth ground. Do not connect the ground lead to high voltage. Improper way of connection could result in dangerous voltages being present on the connectors, controls or other surfaces of the oscilloscope and probes, which will cause potential hazards for operators.
Observe All Terminal Ratings.
To avoid fire or shock hazard, observe all ratings and markers on the instrument and check your manual for more information about ratings before connecting the instrument.
Use Proper Overvoltage Protection.
Ensure that no overvoltage (such as that caused by a bolt of lightning) can reach the product. Otherwise, the operator might be exposed to the danger of an electric shock.
Do Not Operate Without Covers.
Do not operate the instrument with covers or panels removed.
Do Not Insert Objects into the Air Outlet.
Do not insert objects into the air outlet, as doing so may cause damage to the instrument.
Use Proper Fuse.
Please use the specified fuses.
Avoid Circuit or Wire Exposure.
Do not touch exposed junctions and components when the unit is powered on.
Do Not Operate with Suspected Failures.
If you suspect that any damage may occur to the instrument, have it inspected by RIGOL authorized personnel before further operations. Any maintenance, adjustment or replacement especially to circuits or accessories must be performed by RIGOL authorized personnel.
Provide Adequate Ventilation.
Inadequate ventilation may cause an increase of temperature in the instrument, which would cause damage to the instrument. So please keep the instrument well ventilated and inspect the air outlet and the fan regularly.
Do Not Operate in Wet Conditions.
To avoid short circuit inside the instrument or electric shock, never operate the instrument in a humid environment.
Do Not Operate in an Explosive Atmosphere.
To avoid personal injuries or damage to the instrument, never operate the instrument in an explosive atmosphere.
Keep Product Surfaces Clean and Dry.
To avoid dust or moisture from affecting the performance of the instrument, keep the surfaces of the instrument clean and dry.
Prevent Electrostatic Impact.
Operate the instrument in an electrostatic discharge protective environment to avoid damage induced by static discharges. Always ground both the internal and external conductors of cables to release static before making connections.
Use the Battery Properly.
Do not expose the battery (if available) to high temperature or fire. Keep it out of the reach of children. Improper change of a battery (lithium battery) may cause an explosion. Use the RIGOL specified battery only.
Handle with Caution.
Please handle with care during transportation to avoid damage to keys, knobs, interfaces, and other parts on the panels.
Safety Notices and Symbols
Safety Notices in this Manual:

WARNING
Indicates a potentially hazardous situation or practice which, if not avoided, will result in serious injury or death.

CAUTION
Indicates a potentially hazardous situation or practice which, if not avoided, could result in damage to the product or loss of important data.
Safety Terms on the Product:
DANGER
It calls attention to an operation, if not correctly performed, could result in injury or hazard immediately.
WARNING
It calls attention to an operation, if not correctly performed, could result in potential injury or hazard.
CAUTION
It calls attention to an operation, if not correctly performed, could result in damage to the product or other devices connected to the product.
Safety Symbols on the Product:

Hazardous Voltage

Safety Warning

Protective Earth
Terminal

Chassis Ground

Test Ground
Care and Cleaning
Care
Do not store or leave the instrument where it may be exposed to direct sunlight for long periods of time.
Cleaning
Clean the instrument regularly according to its operating conditions.
- Disconnect the instrument from all power sources.
- Clean the external surfaces of the instrument with a soft cloth dampened with mild detergent or water. When cleaning the LCD, take care to avoid scarifying it.

CAUTION
To avoid damage to the instrument, do not expose it to caustic liquids.

WARNING
To avoid short-circuit resulting from moisture or personal injuries, ensure that the instrument is completely dry before connecting it to the power supply.
Environmental Considerations
The following symbol indicates that this product complies with the WEEE Directive 2002/96/EC.

Product End-of-Life Handling
The equipment may contain substances that could be harmful to the environment or human health. To avoid the release of such substances into the environment and avoid harm to human health, we recommend you to recycle this product appropriately to ensure that most materials are reused or recycled properly. Please contact your local authorities for disposal or recycling information.
RSA3000 Series Overview
RSA3000 series is a new generation of cost-efficient real-time spectrum analyzer with high performance. With superb performance specifications and the clear user interface, the RSA3000 series allows you to operate it through various ways, such as pressing keys on the front panel, using the touch screen, connecting the mouse and the keyboard. Remote communication interfaces are also available. The instrument can be widely used in education science, corporate R&D, industrial production, and other fields.
Main Features:
- Ultra-Real technology
● Frequency: up to 4.5 GHz
● Displayed average noise level (DANL): <-161 dBm (typical)
● Phase noise: <-102 dBc/Hz (typical)
● Level measurement uncertainty: <1.0 dB
● 4.5 GHz tracking generator
● Min. RBW 1 Hz
● EMC filter and quasi-peak detector kit (optional)
● Various measurement functions
● Multiple measurement modes
● Up to 40 MHz real-time analysis bandwidth
● Multiple trigger modes and trigger masks
● Density, Spectrogram, and other display modes
● PC software options
● 10.1" capacitive multi-touch screen; supporting touch gestures - USB, LAN, HDMI and other communication and display interfaces
Document Overview
Topics in this manual:
Chapter 1 Quick Start
This chapter introduces the front/rear panel and user interface as well as announcements during first use of the analyzer.
Chapter 2 Functions of the Front Panel of GPSA
This chapter gives detailed function descriptions of the GPSA's front panel keys and the associated menu keys.
Chapter 3 Functions of the Front Panel of RTSA
This chapter gives detailed function descriptions of the RTSA's front panel keys.
Chapter 4 Input/Output
This chapter introduces the parameter settings for the input/output interface.
Chapter 5 Shortcut Key
This chapter introduces the functions of the shortcut keys on the front panel.
Chapter 6 System Function
This chapter introduces the system function settings.
Chapter 7 Remote Control
This chapter shows how to control the analyzer in remote mode.
Chapter 8 Troubleshooting
This chapter lists the troubleshooting information and messages that may appear during the use of the analyzer.
Chapter 9 Appendix
This chapter lists the options and accessories that can be ordered along with your analyzer as well as the service and support information.
Format Conventions in this Manual:
1. Keys:
The keys on the front panel are usually denoted by the format of "Key Name (Bold) + Text Box". For example, FREQ denotes the FREQ key.
2. Menu Keys:
The menu softkeys are usually denoted by the format of "Menu Word (Bold) + Character Shading". For example, Center Freq denotes the center frequency menu item under the FREQ function key.
3. Connectors:
The connectors on the front or rear panel are usually denoted by the format of "Connector Name (Bold) + Square Brackets (Bold)". For example, [Gen Output 50Ω].
4. Operation Procedures:
"→" represents the next step of operation. For example, FREQ → Center Freq indicates pressing FREQ on the front panel and then pressing the menu softkey Center Freq.
Content Conventions in this Manual:
The RSA3000 series spectrum analyzer includes the following models. This manual takes RSA3045-TG as an example.
| Model | Frequency Range | Tracking Generator |
| RSA3045 | 9 kHz to 4.5 GHz | None |
| RSA3030 | 9 kHz to 3 GHz | None |
| RSA3045-TG | 9 kHz to 4.5 GHz | 4.5 GHz |
| RSA3030-TG | 9 kHz to 3 GHz | 3 GHz |
| RSA3045N | 9 kHz to 4.5 GHz | 4.5 GHz |
| RSA3030N | 9 kHz to 3 GHz | 3 GHz |
| RSA3015N | 9 kHz to 1.5 GHz | 1.5 GHz |
User Manuals of this Product:
Quick Guide, User Guide, Programming Guide, Data sheet, etc. For the desired manual, please download it from www.rigol.com.
Contents
Guaranty and Declaration ....I
Safety Requirement ...... II
General Safety Summary......II
Safety Notices and Symbols...... IV
Care and Cleaning....V
Environmental Considerations...... V
RSA3000 Series Overview...... VI
Document Overview......VII
Chapter 1 Quick Start....1-1
General Inspection 1-2
Appearance and Dimensions.... 1-3
To Prepare for Use.... 1-4
To Adjust the Supporting Legs.... 1-4
To Connect to AC Power 1-5
Turn-on Checkout 1-5
Self-calibration.... 1-5
To Set the System Language.... 1-6
Front Panel 1-7
Function Keys on the Front Panel 1-8
Utility Function Keys on the Front Panel 1-10
Front Panel Key Backlight 1-11
Front Panel Connector....1-12
To Use the Numeric Keypad ....1-14
Rear Panel....1-16
User Interface....1-18
Mouse/Keyboard/Touch Screen Operation Rule....1-20
Mouse Operation Rule....1-20
Keyboard Operation Rule....1-21
Touch Screen Operation Rule 1-22
Menu Operation 1-23
Parameter Setting....1-25
To Use the Built-in Help System 1-27
Fuse Replacement....1-28
Mode Setting 1-29
Mode....1-29
Mode Setup....1-30
Chapter 2 Functions of the Front Panel of GPSA....2-1
Basic Settings 2-2
FREQ....2-2
SPAN 2-8
AMPT 2-9
Sweep and Function Settings....2-14
BW....2-14
Sweep 2-18
Trigger 2-22
Trace....2-26
Tracking Generator 2-32
Measurement Settings 2-35
Meas 2-35
Meas Setup....2-38
Marker Measurement....2-66
Marker....2-66
Marker To 2-73
Marker Function 2-75
Peak....2-79
Chapter 3 Functions of the Front Panel of RTSA.... 3-1
Basic Settings....3-2
FREQ....3-2
SPAN....3-2
AMPT 3-6
Sweep and Function Settings....3-7
BW....3-7
Sweep 3-9
Trigger 3-11
Trace....3-16
Measurement Settings 3-18
Meas 3-18
Meas Setup....3-26
Marker Setup....3-33
Marker....3-33
Marker To 3-33
Marker Function 3-33
Peak 3-33
Chapter 4 Input/Output.... 4-1
Input Impedance....4-1
Ext Gain 4-1
Ext Trigger2 4-1
Demod 4-2
Demod Setup....4-2
Chapter 5 Shortcut Key.... 5-1
Auto Tune....5-1
Preset....5-3
User 5-9
Quick Save....5-9
Cont 5-9
Single 5-9
Chapter 6 System Function....6-1
System 6-1
File....6-9
Recall 6-13
Save....6-15
Chapter 7 Remote Control....7-1
Remote Control Overview.... 7-2
Remote Control via USB 7-3
Remote Control via LAN 7-4
Chapter 8 Troubleshooting....8-1
Chapter 9 Appendix....9-1
Appendix A: RSA3000 Accessories and Option List 9-1
Appendix B: Warranty 9-3
Index 1
Chapter 1 Quick Start
This chapter gives you a quick review about the appearance and dimensions of the RSA3000 series, its front and rear panel, user interface, as well as announcements during first use of the analyzer.
Contents in this chapter:
■ General Inspection
■ Appearance and Dimensions
■ To Prepare for Use
■ Front Panel
■ Rear Panel
■ User Interface
■ Mouse/Keyboard/Touch Screen Operation Rule
■ Menu Operation
■ Parameter Setting
■ To Use the Built-in Help System
■ Fuse Replacement
■ Mode Setting
General Inspection
1. Inspect the packaging
If the packaging has been damaged, do not dispose the damaged packaging or cushioning materials until the shipment has been checked for completeness and has passed both electrical and mechanical tests.
The consigner or carrier shall be liable for the damage to the instrument resulting from shipment. RIGOL would not be responsible for free maintenance/rework or replacement of the instrument.
2. Inspect the instrument
In case of any mechanical damage, missing parts, or failure in passing the electrical and mechanical tests, contact your RIGOL sales representative.
3. Check the accessories
Please check the accessories according to the packing lists. If the accessories are damaged or incomplete, please contact your RIGOL sales representative.
Appearance and Dimensions

Figure 1-1 Front View
Unit: mm

Figure 1-2 Vertical View
Unit: mm
To Prepare for Use
To Adjust the Supporting Legs
You can unfold the supporting legs to use them as stands to tilt the instrument upwards for easier operation and observation. You can also fold the supporting legs for easier storage or shipment when the instrument is not in use.

Figure 1-3 To Adjust the Supporting Legs
To Connect to AC Power
Please use the power cord provided in the accessories to connect the spectrum analyzer to the AC power source. The AC power supply specification of this spectrum analyzer is 100-240 V, 45-440 Hz. The power consumption of the instrument cannot exceed 95 W. When the spectrum analyzer is connected to the AC power source via the power cord, the instrument automatically adapts to the voltage range, and you do not need to select the voltage range manually.


CAUTION
To avoid electric shock, ensure that the instrument is correctly grounded.
Turn-on Checkout
After connecting the instrument to the power source properly, press the Power key on the front panel to start the spectrum analyzer. Then, you will see an initial splash screen. Following the start-up screen which shows the start-up initialization process information, the sweep curve is displayed.
Self-calibration
After the instrument starts, execute self-calibration.
Press System → Alignment → Align Now, and then the instrument will perform self-calibration with the internal calibration source.
To Set the System Language
RSA3000 series spectrum analyzer supports multiple system languages. You can press System → Language to switch the system language.
Front Panel
The front panel of RSA3000 is shown in the following figure.

Figure 1-4 Front Panel
Table 1-1 Front Panel Description
| No. | Description | No. | Description |
| 1 | LCD | 9 | Numeric keypad |
| 2 | Menu softkeys | 10 | Tracking generator output[1] |
| 3 | Back to previous menu item | 11 | Utility function key area |
| 4 | Function key area | 12 | Page up/down key |
| 5 | Help key | 13 | Speaker |
| 6 | Knob | 14 | Earphone jack |
| 7 | Arrow keys | 15 | USB HOST |
| 8 | RF input | 16 | Power key |
Note [1] : This function is only available for RSA3045-TG/RSA3030-TG.
Function Keys on the Front Panel
![graph TD A["Mode Setup"] --> B["Meas Setup"] B --> C["Auto Tune"] C --> D["Preset"] E["FREQ"] --> F["B W"] F --> G["Input Output"] G --> H["Marker"] H --> I["Peak"] J["SPAN"] --> K["Trace"] K --> L["TG"] L --> M["Marker"] M --> N["Marker Func"] O["AMPT"] --> P["Sweep"] P --> Q["Cont"] Q --> R["Singl…](/content/2026/07/1497176/images/5c7cc1c32890ebbfecae31857299e8129a470730a30a0a2fc276d9c3a48036bf.jpg)
Figure 1-5 Function Keys
Table 1-2 Descriptions of Function Keys on the Front Panel
| Function Key | Description |
 | Sets the parameters such as center frequency, start frequency, and stop frequency; enables the signal tracking function. |
 | Sets the frequency span of the sweep. |
 | Sets the parameters such as reference level, RF attenuator, scale, and Y-axis unit. Enables preamp. |
 | Sets the parameters such as resolution bandwidth (RBW) and video bandwidth (VBW). |
 | Sets the parameters such as input impedance, external gain, and External Trigger 2. Selects the RF calibration signal. |
 | Reads the amplitude and frequency of a certain point on the trace via marker. |
 | Opens the peak search menu and searches for peaks immediately. |
 | Sets the parameters related to trace. |
 | Sets the parameters related to the tracking generator [1] . |
 | Sets other system parameters based on the current marker value. |
 | Indicates the special functions of the marker, such as noise marker, N dB bandwidth measurement, and frequency counter. |
 | Sets the sweep parameters. |
 | Sets the sweep/measurement mode to be continuous. |
 | Sets the sweep/measurement mode to be single. |
 | Sets the trigger source and its related parameters. |
 | Selects the working mode of the spectrum analyzer. |
 | Sets the parameters for the selected working mode. |
 | Selects and controls the measurement function[2]. |
 | Sets the parameters[2] for the selected measurement function. |
 | Searches for signals automatically within full frequency range. |
 | Restores the system to factory settings or user-defined state. |
 | Sets the system parameters. |
 | Recalls the files. |
 | Manages the files. |
 | Saves the files. |
 | User-defined shortcut key. |
 | Provides quick save function. |
Note [1] : This function is only available for RSA3045-TG/RSA3030-TG.
Note [2] : This function is only available for the instrument installed with RSA3000-AMK.
Tip:
Click the function keypad icon 📄 at the right corner of the LCD or finger-touch it, and then the function keypad that corresponds to the specified keys on the front panel appears. At this time, you can operate the instrument with the function keypad.
Utility Function Keys on the Front Panel
Table 1-3 Descriptions of Utility Function Keys on the Front Panel
 | Locks all the keys (except the Power key) on the front panel. |
 | Locks the touch screen of the instrument. |
 | In the multi-window display mode, press this key to select the specified window to zoom it in or out. |
 | In the multi-window display mode, press this key to switch the window. |
Front Panel Key Backlight
The on/off state and the color of the backlights of some keys on the front panel indicate the working state of the spectrum analyzer. The states are listed below.
1. Power Key

- Flash on and off alternatively, in breathing state: indicates that the unit is in stand-by state.
- Constant on: indicates that the instrument is in normal operating state.
2. Auto Tune
When you press the Auto Tune key, it is illuminated. The instrument starts sweeping within the full frequency range, searches for the signal with the maximum amplitude and moves it to the center of the screen. After the sweep is completed, the backlight turns off.
3. Tracking Generator
When the tracking generator function is enabled, the TG key is illuminated; when disabled, the backlight of the TG key is off.
4. Single
When the Single key is illuminated, it indicates that the sweep/measurement mode is single.
5. Keypad Locking Key

When the backlight is on, it indicates that all the keys (except the Power key) on the front panel is locked. Press the key again to unlock the front panel keys, and then the backlight of the key is off.
6. Touch Screen Locking Key

When the backlight is on, it indicates that the touch screen of the instrument is locked. Press the key again to unlock the touch screen, and then the backlight is off.
Front Panel Connector

Figure 1-6 Front Panel Connector
1. USB HOST
The analyzer can serve as a "master" device to connect to the external USB device. The USB storage device, mouse, and keyboard can be connected to the instrument via the interface.
- USB Storage Device
Reads the state file, trace+state file, measurement data file, limit line file, and FMT file (in RTSA mode) from the USB storage device; or stores the current instrument state, trace, measurement data, limit line, or FMT to the USB storage device; or stores the contents currently displayed on the screen to the USB storage device in ".jpg", ".bmp", or ".png" format.
- Mouse
After the mouse is properly connected to the instrument, you can use it to click on the screen to perform parameter setting and function configuration. For details, refer to descriptions in "Mouse/Keyboard/Touch Screen Operation Rule".
- Keyboard
After the keyboard is properly connected to the instrument, you can use the shortcut keys on the keypad to perform the same function as what you do with the front panel keys. For details, refer to descriptions in "Mouse/Keyboard/Touch Screen Operation Rule".
2. Earphone Jack
Insert the earphone to the jack to acquire the audio output of the demodulated
signal.

CAUTION
To avoid damaging your hearing, please turn the volume down to zero first and then gradually turn the volume up after putting on the earphone.
3. Gen Output 50Ω
The output of the tracking generator can be connected to a receiver through a cable with an N male connector. This function is only available for RSA3045-TG/RSA3030-TG.

CAUTION
To avoid damage to the tracking generator, the reverse power cannot exceed +10 dBm when the frequency is lower than 10 MHz; the reverse power cannot exceed +20 dBm when the frequency is greater than 10 MHz. The reverse DC voltage should not exceed 50 V.
4. RF Input 50Ω
The input terminal of the signal under test. [RF Input 50Ω] can be connected to the device under test (DUT) via a cable with an N male connector.

CAUTION
For the signal input to the RF input terminal, ensure that the DC voltage component and the maximum continuous power of the AC (RF) signal component do not exceed 50 V and +30 dBm to avoid damaging the instrument.
To Use the Numeric Keypad
The numeric keypad is available on the front panel of RSA3000, as shown in the figure below. The numeric keypad supports the Chinese characters, English uppercase/lowercase letters, numbers, and common symbols (including decimal point, space, and +/- signs), which are mainly used to edit the file/folder name and set parameters (refer to "Parameter Setting").

Figure 1-7 Numeric Keypad
The numeric keypad consists of the following parts:
1. Number/Letter
- Multiplexing keys for numbers and letters. They are used to directly input the desired number or letter.
- : preAs this key to input 1 in number input; to switch between uppercase and lowercase letter in English input. This key is invalid in Chinese input.
- is the multiplexing key for 0 and space. Press this key to input 0 in number input and space in Chinese or English input.

2.

- Press this key to input a decimal point at the current cursor position in number input.
● This key is invalid in Chinese or English input.
3.

- The number input mode is, by default, selected for parameter setting. Press this key to input the symbol (+" or "-"). When you press the key for the first time, the parameter symbol "-" is displayed, and when you press it again, "+" is displayed.
- When you input a file or folder name, press this key repeatedly to switch among the Chinese input, English input, and number input.
4.
Local
Esc
- When editing the parameter, press this key to exit parameter input.
- When you edit the filename with the on-screen keyboard, press this key to hide the on-screen keyboard.
- In multi-touch test, single-touch test, and keyboard test state, press this key to exit the current test state.
- When the instrument is in remote mode, press this key to return to the local mode.
5.
Back
- When editing the parameter, press this key to delete the character to the left of the cursor.
- When editing the file name, press this key to delete the character to the left of the cursor.
6.
Enter
During parameter editing, pressing this key will complete the input and insert a default unit for the parameter.
Rear Panel
The rear panel of RSA3000 is shown in the following figure.
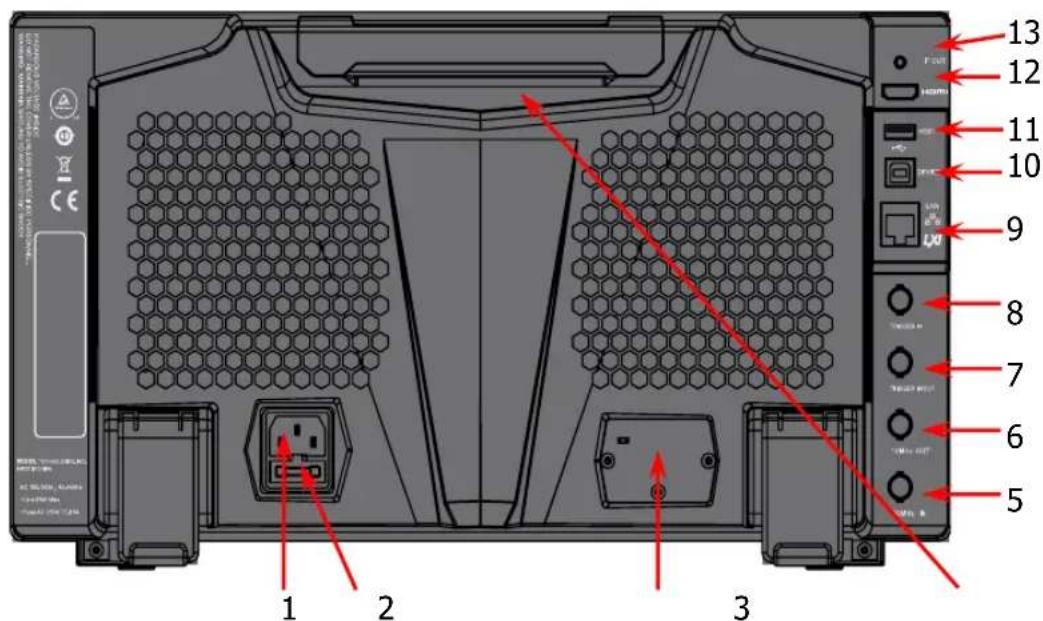
Figure 1-8 Rear Panel
1. AC Power Cord Connector
The AC power supply specification of RSA3000 is: 100-240 V; 45-440 Hz.
2. Fuse Holder
You can replace the fuse. The fuse rating supported by the instrument is AC 250 V, T3.15 A.
3. OCXO (Option)
OCXO (Oven Controlled Crystal Oscillator) can provide a highly stable frequency reference over temperature variations. For order information of the option, refer to the datasheet manual. Note: A 40-minute warm-up is required for OCXO to reach its nominal frequency.
4. Handle
You can rotate the handle upright and make the portable instrument easy to carry.
5. 10MHz IN
RSA3000 can use the internal or external reference source.
- When a 10 MHz external clock signal is received at the [10 MHz IN] connector, this signal is used as the external reference source. At this time, the status bar of the user interface displays "Ext". When the external
reference is lost, transfinite, or not connected, the instrument switches to the internal reference automatically. At this time, the icon "Ext" in the status bar of the user interface disappears.
- The [10MHz IN] and [10MHz OUT] connectors are usually used to realize synchronization among multiple instruments.
Note: When you input or disconnect an external clock signal for the first time, the network will be reconfigured.
6. 10MHz OUT
RSA3000 can use the internal or external reference source.
- When the internal reference source is used, the [10MHz OUT] connector can output a 10 MHz clock signal generated by the analyzer. This signal can be used to synchronize other instruments.
- The [10MHz OUT] and [10MHz IN] connectors are usually used to realize synchronization among multiple instruments.
7. TRIGGER IN/OUT
Indicates the input and output terminal of Ext Trigger2. You can press Input Output → Ext Trigger2 to set it to be the external trigger input interface; or use it to synchronize the trigger output interfaces of other test devices.
8. TRIGGER IN
Indicates the input terminal of Ext Trigger1. The Ext Trigger1 signal is sent to the spectrum analyzer through a BNC cable.
9. LAN
Through this interface, the analyzer can be connected to your local network for remote control. An integrated testing system can be built quickly, as the analyzer conforms to LXI Core 2011 Device instrument standards.
10. USB DEVICE
The analyzer can serve as a "slave" device to connect to the external USB device. The analyzer can be connected to the PC through this interface. Then, the RSA3000 series spectrum analyzer can be controlled remotely through programming or the PC software.
11. USB HOST
The analyzer can serve as a "master" device to connect to the external USB device. The USB storage device, the keyboard, and the mouse can be connected to the instrument via the interface.
12. HDMI
The interface is used to connect to the display, enabling you to clearly observe the signal under test and its characteristics.
13. IF OUT
Indicates the intermediate frequency signal in the output RF component. Its center frequency is 430 MHz.
User Interface

Figure 1-9 User Interface
Table 1-4 User Interface Icons
| No. | Name | Description |
| 1 | Reference level | Displays the reference level value. |
| 2 | Measurement result | Displays the current measurement results for the marker (when no marker exists, the measurement results display frequency/span value). |
| 3 | RIGOL | Indicates the company logo. |
| 4 | System status | Rmt: indicates remote operation.Ext: indicates the external reference.Uncal: indicates that the measurement has not be calibrated.PA on: indicates that the preamp has been enabled.TG on: indicates that the tracking generator has been enabled. |
| 5 | Trace indicator[1] | Displays information about the trace and the detector. |
| 6 | Information setting | : indicates messages, such as the prompt messages, alarm messages, and error messages. : indicates the speaker. You can tune it up and down to increase and decrease the speaker volume, or set it to mute : indicates the network settings. You can configure network parameters. : unlocks the front panel keys; locks the front panel keys. : unlocks the touch screen; locks the touch screen. : indicates that no USB storage device is inserted; indicates that a USB storage device has been inserted. |
| 7 | Measurement bar | Displays measurement settings. |
| 8 | Measurement function | Displays the currently selected measurement function. |
| 9 | Working mode | Displays the currently selected working mode. |
| 10 | Function keypad | Clicks the keypad to display the function keypad interface. |
| 11 | Active function area | Displays the current parameter and its value. |
| 12 | Time | Displays the system time. |
| 13 | Menu title | Displays the currently selected menu name. |
| 14 | Menu item | Displays the menu item of the current function. |
| 15 | Menu page | Shows the current page and the total number of pages for the menu. |
| 16 | Sweep time and points | Indicates the sweep time and the number of sweep points in swept mode. |
| 17 | Span or stop frequency | The frequency range of the current sweep channel can be expressed by the combination of center frequency and span or the combination of start frequency and stop frequency. |
| 18 | Trigger level | Indicates video trigger level. |
| 19 | Display line | Indicates the readout reference and the threshold criteria for the peak |
| 20 | VBW | Indicates video bandwidth. |
| 21 | Spectrum line display area | Indicates the display area for the spectrum line. |
| 22 | RBW | Indicates the resolution bandwidth. |
| 23 | Center or start frequency | The frequency range of the current sweep channel can be expressed by the combination of center frequency and span or the combination of startfrequency and stop frequency. |
| 24 | Y scale | Indicates the scale indication in the Y axis. |
Note [1] : The display of the trace indicator is shown in the following figure:

- The first line displays the trace number. The color of the number is the same as that of the trace.
- The second line displays the trace type, including W (Clear/Write), A (Average), M (Maximum Hold), and m (Minimum Hold). The letters with different colors and in different forms show different meanings.
— The letter in blue indicates that the trace is updating.
— The letter in gray indicates that the trace is not updated.
— The letter with strikethrough and in gray color indicates that the trace will neither be updated nor displayed.
— The letter with strikethrough and in blue color indicates that the trace is updating but not displayed. It is useful in trace math operation.
- The third line displays the detector type of each trace, including N (Normal, only available for GPSA), V (Voltage Average, only available for GPSA), P (Positive Peak), p (Negative Peak), S (Sample), R (RMS Average, only available for GPSA), Q (Quasi Peak, option, only available for GPSA), and A (Average, only available for RTSA). If it shows "f", it indicates that it is math operation trace. The letter in blue in the third line (detector type) indicates that the detector is in auto state; the letter in white indicates that it is in manual state.
Mouse/Keyboard/Touch Screen Operation Rule
Mouse Operation Rule
Connect the mouse (note that only the left-click operation is supported; the scroll and right-click operations with the mouse are not supported) to the spectrum analyzer via the USB HOST interface to perform the following operations:
- Click to select the menu and window.
- Press and hold the left mouse button to drag the data displayed on the graticule or move the slide bar.
- Double-click the data displayed on the graticule and then the data will be appeared at the right-corner.
- Under the Marker function, you can only use the mouse to move a marker, but unable to add a marker with the mouse.
Keyboard Operation Rule
Connect the keyboard to the spectrum analyzer via the USB HOST interface, and then use the shortcut keys on the keyboard to perform the same function as what you do with the front panel keys.
Table 1-5 Matching Relations between the Front Panel Keys and the Keyboard Shortcut Keys
| Front Panel Key | Keyboard Shortcut Key[1] | |
| Mode | Alt + o | |
| Mode Setup[2] | Shift + o | |
| Meas | Alt + e | |
| Meas Setup[2] | Shift + e | |
| Auto Tune | Ctrl + Alt + a | |
| Preset | Ctrl + Alt + p | |
| FREQ[2] | Shift + f | |
| SPAN[2] | Shift + s | |
| AMPT[2] | Shift + a | |
| BW[2] | Shift + b | |
| Trace[2] | Shift + t | |
| Sweep[2] | Shift + w | |
| Input Output[2] | Shift + i | |
| TG[2] | Shift + g | |
| Cont | F11 | |
| Marker[2] | Shift + m | |
| Marker ->[2] | Shift + k | |
| Single | F12 | |
| Peak[2] | Shift + p | |
| Marker Fund[2] | Shift + u | |
| Trigger[2] | Shift + r | |
| System[2] | Shift + y | |
| File | Ctrl + f | |
| User | Ctrl + u | |
| Recall | Ctrl + r | |
| Save | Ctrl + s | |
| Quick save | Ctrl + Alt + q | |
| Help | Alt + F1 | |
 | Alt + F2 | |
| Alt + F3 | ||
 | Alt + F4 | |
| Alt + F5 | ||
 | Page Up | |
| Page Down | ||
| 11 numeric keys | Numeric keys on the keyboard: 10 numeric | |
| numbers (1, 2, 3, 4, 5, 6, 7, 8, 9, 0) and a decimal point(.) | ||
| + | + | |
| - | - | |
| Esc | Esc | |
| Back | Backspace | |
| Enter | Enter | |
| Arrow keys(Up/Down/Left/Right arrow key) | ↑, ↓, ←, → | |
| 7 menu softkeys from top to bottom | F1 to F7 | |
Note [1] : Except the keyboard shortcut keys mentioned in the above table, all the other keys on the keyboard do not work for the menu operation.
Note [2] : When the Caps Lock key is enabled, every letter you type would be in uppercase, even if you're not holding down the "Shift" key. If disabled, you have to press down "Shift" and the specified letter on the keyboard at the same time to input the letter in uppercase. For example, if you want to execute the "Shift+f" shortcut key operation, you only need to press "f" on the premise that the Caps Lock key is enabled.
Touch Screen Operation Rule
RSA3000 has a 10.1-inch capacitive multi-touch screen that supports touch gestures.
-
When operating on the menus other than the Marker menu:
-
Tap the trace window, then slide left and right to modify the center frequency; slide up and down to modify the reference level.
-
Stretch two fingers horizontally in the trace window to decrease the span, and pinch the fingers horizontally to increase the span. Stretch two fingers in the vertical direction to decrease the Y-axis scale, and pinch the fingers vertically to increase the Y-axis scale.
-
When operating on the Marker menu:
-
In the empty space of the screen trace region, press and hold the region to add one new marker.
- Tap and hold one marker to drag the marker.
Menu Operation
There are 6 types of menus according to their operation modes. Each type of menu and its operation method are introduced below.
1. Parameter Input

Select the menu and use the numeric keys to modify the value directly.
For example, to modify center frequency, first select Center Freq, and then input the desired value. Then, press Enter to complete parameter input.
2. State Switching

Press the corresponding menu key to switch between the sub-options.
For example, press Signal Track, and then you can switch between "On" and "Off" to enable or disable the signal tracking function.
3. Enter Lower-level Menu (with parameter)

Press the corresponding menu key to enter the lower-level menu and change the currently selected option. The parameter type in the upper-level menu will be changed when you return to the upper-level menu again.
For example, press Y Axis Unit to enter the lower-level menu. Select dBm and then automatically return to the previous menu automatically. Then, the unit of Y-axis will be changed to dBm.
4. Lower-level Menu (without parameter)

Press the corresponding menu key to enter the lower-level menu.
For example, press Peak Config to enter the lower-level menu directly.
5. Direct Execution

Press the key to execute the corresponding function. For example, press Mkr->CF to set the center frequency of the analyzer to the frequency of the current marker.
6. State Selection

Press the corresponding menu key and modify the parameters, and then go back to the previous menu. For example, press Source → Free Run to select free trigger. The analyzer is in Free Run state at present.
Tip:
The above menu operations can be executed by touch gestures or clicking with the externally connected mouse. Also, you can connect to the keyboard and use the shortcut keys to perform the above menu operations. For the matching relations between the front panel keys and the keyboard shortcut keys, refer to Table 1-5.
Parameter Setting
You can enter the desired parameter values by using the numeric keys, the knob, or arrow keys on the front panel. Also, you can set the parameters by using the touch screen, the externally connected keypad or the mouse. This section takes an example (set the center frequency to 800 MHz) to describe six methods of parameter setting.
1. Use the numeric keys
1) Press FREQ → Center Freq;
2) Input 800 by using the numeric keys;
3) Select the desired unit (MHz) from the pop-up menu.
2. Use the knob
When the parameter is editable, turn the knob clockwise to increase or counterclockwise to decrease the parameter value at the specified step.
1) Press FREQ → Center Freq;
2) Rotate the knob until the parameter is set to the desired value (800 MHz).

Figure 1-10 Knob
3. Use the arrow keys
When the parameter is editable, use the arrow keys to increase or decrease the parameter value at the specific step. Note that the step sizes for the Up/Down arrow key and the Left/Right arrow key are different.
1) Press FREQ → Center Freq;
2) Press the Up/Down arrow key or the Left/Right arrow key until the parameter is set to the desired value (800 MHz).

Figure 1-11 Arrow Keys
4. Use the touch screen
1) Touch the screen to select the function keypad icon ☐ at the upper-right corner. Then, the function keypad is displayed. Touch "FREQ";
2) Click Center Freq;
3) Then the numeric keypad is displayed. Input 800, and select the desired unit "MHz".
5. Use the keyboard
1) Press "Shift + f" to open the Frequency menu;
2) Press "F1" to select Center Freq;
3) Input 800 by using the numeric keys;
4) Press "F2" to select the desired unit (MHz) from the pop-up menu.
For the matching relations between the front panel keys and the keyboard shortcut keys, refer to Table 1-5.
6. Use the mouse
1) Click with the mouse to select the function keypad icon ☐ at the upper-right corner of the screen. Then, the function keypad is displayed. Click "FREQ";
2) Click Center Freq;
3) Then the numeric keypad is displayed. Input 800, and select the desired unit "MHz".
To Use the Built-in Help System
The built-in help system provides information about every function key on the front panel and every menu softkey.
1. Get the built-in help information
Press Help and a prompt message about how to obtain help information will be shown on the screen. Then, press the key that you want to know about its usage, and then the relevant help information for the key will be shown on the screen.
2. Page up/down operation
If the help information is displayed in several pages, you can press the arrow keys or use the knob to page up and down the help information.
3. Close the current help information
Press any key on the front panel to close the help information currently displayed on the screen.
When the help information is displayed on the screen, perform any of the following operations to close the currently displayed help information dialog box:
- press Esc;
- press the Help key again; or
- click OK in the displayed help information dialog box.
4. Get the help information of the menu key
Press Help, and the help information display window is displayed on the screen. Then, press the menu key and the help information of the corresponding menu item is displayed.
5. Get the help information of any function key
Press Help, and the help information display window is displayed on the screen. Then, press any function key and the corresponding function help information is displayed.
Fuse Replacement
If you need to replace the fuse, use only the specified fuse (AC 250V, T3.15A) and perform the following operations:
- Turn off the instrument, cut off the power, and remove the power cord.
- Use a small straight slotted screwdriver to pry out the fuse holder.
- Take out the fuse holder.
- Replace the old fuse with a specified fuse.
- Install the fuse holder.

Figure 1-12 To Replace the Fuse

WARNING
To avoid electric shock, please ensure that the instrument has been turned off, the power source has been cut off, and the fuse to be used conforms to the fuse rating.
Mode Setting
Mode
Provides two working modes: GPSA and RTSA.
Note: In different working modes, the functions of the keys on the front panel may be different. Press Help to dis
play the help information of the current working mode. If you need help information for other modes, exit the help interface first. Then select the desired working mode and obtain the corresponding help information.
1. GPSA
GPSA adopts two analysis methods: swept and FFT. GPSA can not only carry out frequency domain analysis, but also time domain (zero span) analysis.
Select GPSA. In this working mode, press Meas to select multiple measurements. For details, refer to Chapter 2.
2. RTSA
RTSA provides the analysis function for the real-time signal, which can capture the complex signal seamlessly.
Select RTSA. Select RTSA. In this working mode, you can also press Meas to select multiple measurements. For details, refer to Chapter 3.
Mode Setup
The Mode Setup menu is used to set parameters global to different measurements under all working modes. These parameters are independent of the currently running measurement, and they are global to all the measurements.
Open the global parameter setting menu for the selected working mode under Mode.
1. Global CF Mode
Turns on or off the global center frequency. In any working mode, if you enable the global center frequency, then the global center frequency will be set to the center frequency of the current mode. When you switch to a different working mode, the global center frequency will be set to the center frequency of its previous working mode. If you change the center frequency in any working mode, then the global center frequency will change with it.
2. Global CF
Sets the global center frequency. It is only available when you turns on the global center frequency.
3. Mode Preset
Resets the parameters of the current mode to be the factory default settings.
Chapter 2 Functions of the Front Panel of GPSA
This chapter describes in detail the function keys on the front panel and their associated menu functions in the GPSA mode of RSA3000.
Contents in this chapter:
■ Basic Settings
■ Sweep and Function Settings
■ Measurement Settings
■ Marker Measurement
Basic Settings
FREQ
Sets the frequency parameters of the analyzer. The analyzer sweeps within a specified frequency range and restarts sweeping every time the frequency parameters are modified.
The frequency range of a channel can be expressed by either of two groups of parameters: Start Frequency/Stop Frequency ( fstart / fstop ); or Center
Frequency/Span ( fcenter/fspan ). If any of the four parameters is changed, the other three parameters will make adjustment automatically to ensure the coupling relationship among them:
( fff + / 2 _ startstopce 2-1
f _ span = ff _ starts 2-2
Center Freq
Sets the center frequency (that corresponds to the horizontal center of the graticule) of the current channel. Press this key or touch the specified menu item on the screen to set the frequency entry mode to Center Frequency/Span. The center frequency and span values are respectively displayed at the lower left and right side of the graticule.
Remarks:
- When you modify the center frequency, the start and stop frequency will be modified automatically if the span remains to be unchanged.
- Modifying the center frequency indicates that the frequency is changed along the current channel horizontally, and the adjustable range should be within the frequency range specified in the technical specifications of the analyzer.
- In zero span mode, the values of start frequency, stop frequency, and center frequency are the same, so once one of the parameter values is modified, the other two values will be modified automatically.
- You can use the numeric keys, the knob, and the arrow keys on the front panel to modify this parameter; also you can modify it on the touchscreen. For details, refer to descriptions in "Parameter Setting".
Table 2-1 Center Frequency
| Parameter | Remarks |
| Default | Fmax[1]/2 |
| Range | (Smin/2)[2] to (Fmax - Smin/2) |
| Unit | GHz, MHz, kHz, Hz |
| Knob Step | span > 0, step = span/200 |
| span = 0, step = RBW/100 | |
| Min = 1 Hz | |
| Left/Right Arrow Key Step | |
| Up/Down Arrow Key Step | CF step |
Note [1] : Fmax (maximum measurement frequency) is determined by the model of the spectrum analyzer. RSA3000 includes two models: 3 GHz and 4.5 GHz
Note [2] : Smin indicates the minimum span in non-zero span.
Start Freq
Sets the start frequency of the current frequency channel. Press this key or touch the specified menu item on the screen to set the frequency entry mode to Start Frequency/Stop Frequency. The start frequency and stop frequency values are respectively displayed at the lower left and right side of the graticule.
Remarks:
- When you modify the start frequency, the span and center frequency will be changed. The changes of span will affect other system parameters. For details, please refer to "Span".
- In zero span mode, the values of start frequency, stop frequency, and center frequency are the same, so once one of the parameter values is modified, the other two values will be modified automatically.
- You can use the numeric keys, the knob, and the arrow keys on the front panel to modify this parameter; also you can modify it on the touchscreen. For details, refer to descriptions in "Parameter Setting".
Table 2-2 Start Frequency
| Parameter | Remarks |
| Default | center frequency-span/2 |
| Range[1] | 0 Hz to Fmax |
| Unit | GHz, MHz, kHz, Hz |
| Knob Step | span > 0, step = span/200 span = 0, step = RBW/100 Min = 1 Hz |
| Left/Right Arrow Key Step | |
| Up/Down Arrow Key Step | CF step |
Note [1] : The range is from 0 Hz to (Fmax-100 Hz) in non-zero span. If option RSA3000-BW1 is installed, the available range is from 0 Hz to (Fmax-10 Hz).
Stop Freq
Sets the stop frequency of the current frequency channel. Press this key or touch the specified menu item on the screen to set the frequency entry mode to Start Frequency/Stop Frequency. The start frequency and stop frequency values are respectively displayed at the lower left and right side of the graticule.
Remarks:
- When you modify the stop frequency, the span and center frequency will be changed. The changes of span will affect other system parameters. For details, please refer to "Span".
- In zero span mode, the values of start frequency, stop frequency, and center frequency are the same, so once one of the parameter values is modified, the other two values will be modified automatically.
● You can use the numeric keys, the knob, and the arrow keys on the front panel
to modify this parameter; also you can modify it on the touchscreen. For details, refer to descriptions in "Parameter Setting".
Table 2-3 Stop Frequency
| Parameter | Remarks |
| Default | center frequency+span/2 |
| Range[1] | 0 Hz to Fmax |
| Unit | GHz, MHz, kHz, Hz |
| Knob Step | span > 0, step = span/200 |
| span = 0, step = RBW/100 | |
| Min = 1 Hz | |
| Left/Right Arrow Key Step | |
| Up/Down Arrow Key Step | CF step |
Note [1] : The range is from 100 Hz to Fmax in non-zero span. If option RSA3000-BW1 is installed, its minimum value can be set to 10 Hz.
CF Step
Changes the step size for the center frequency. Changing the center frequency by a constant step-size value switches the channel to be measured continuously.
Remarks:
- Set a proper CF step value, and then select the center frequency. Use the Up/Down arrow key to switch the measurement channel at a fixed step size. Thus, the instrument can sweep the adjacent channels manually.
- You can use the numeric keys, the knob, and the arrow keys on the front panel to modify this parameter; also you can modify it on the touchscreen. For details, refer to descriptions in "Parameter Setting".
Table 2-4 CF Step
| Parameter | Remarks |
| Default | Fmax/10 |
| Range | -Fmax to Fmax |
| Unit | GHz, MHz, kHz, Hz |
| Knob Step | span > 0, step = span/200 |
| span = 0, step = RBW | |
| Left/Right Arrow Key Step | Min = 1 Hz |
| Up/Down Arrow Key Step | at 1-2-5 step |
CF Step Mode
The CF step mode consists of "Manual" and "Auto".
Remarks:
- In Auto mode, the CF step is 1/10 of the span in non-zero span mode or equals to RBW while in zero span mode.
- In Manual mode, you can use the numeric keys to set the step size.
Freq Offset
You can set a frequency offset value to account for frequency conversions between the device under test (DUT) and the input terminal of the spectrum analyzer.
Remarks:
- The change of this parameter only changes the display values of the center frequency, start frequency, and stop frequency; but does not affect any hardware settings of the spectrum analyzer.
- You can use the numeric keys, the knob, and the arrow keys on the front panel to modify this parameter; also you can modify it on the touchscreen. For details, refer to descriptions in "Parameter Setting".
● To eliminate the frequency offset, you can set the frequency offset to 0 Hz.
Table 2-5 Frequency Offset
| Parameter | Remarks |
| Default | 0 Hz |
| Range | -500 GHz to 500 GHz |
| Unit | GHz, MHz, kHz, Hz |
| Knob Step | span > 0, step = full span/200 |
| Left/Right Arrow Key Step | |
| Up/Down Arrow Key Step | CF step |
Signal Track
Enables or disables the signal tracking function. This function is used to track and measure the signal whose frequency is unstable and whose transient variation in amplitude is less than 3 dB. Place Marker1 (refer to descriptions in "Marker Measurement") onto the signal under test to track and measure the variation of the signal. The signal tracking process is shown in the following figure:
![graph TD A["Start"] --> B["Execute a sweep"] B --> C{Active Marker exists?} C -->|Y| D["Search for and mark the frequency point (variation < 3dB) near the Marker"] C -->|N| E["Search for peak and mark it as Marker"] E --> F["Set marker frequency to center freq"] D --> F F --> G["Execute the next swe…](/content/2026/07/1497176/images/c379db87fbb0006e524716910b3a3175bbe230089734b4174005e07219b43741.jpg)
Figure 2-1 Signal Tracking Process
Remarks:
- If an active marker currently exists, when Signal Track is enabled, the instrument will search for and mark the point (whose amplitude variation is less than 3 dB) near the marker. Then, set the frequency at this point to be the center frequency to keep the signal at the center of the screen.
- If no marker is currently active, when Signal Track is enabled, the instrument will activate Marker1, execute a peak search automatically, and set the frequency value at the current peak to be the center frequency to keep the signal always displayed at the center of the screen.
- In continuous sweep, the system tracks the signal continuously; in single sweep, the instrument only performs a single signal track.
- The signal tracking function is only applicable to the swept analysis. The signal tracking function is invalid in the following conditions:
— In zero span mode;
— When the tracking generator is enabled;
— When the trace is not updated;
— When the continuous peak search is enabled;
— In advanced measurement mode.
SPAN
Sets the span of the analyzer. Changing this parameter will change the frequency parameters, and after the span is changed, the sweep restarts.
Span
Sets the frequency range of the current channel. Press this key or touch the specified menu item on the screen to set the frequency entry mode to Center Frequency/Span. The center frequency and span values are respectively displayed at the lower left and right side of the graticule.
Remarks:
- When you modify the span, the start and stop frequency will be modified automatically, with the center frequency remains to be unchanged.
- In non-zero span, the span can be set to a minimum of 100 Hz. If option RSA3000-BW1 is installed, its minimum value can be set to 10 Hz. When the span is set to a maximum value, the spectrum analyzer enters the full span mode.
- You can set the span to 0 Hz manually; you can press the Zero Span menu item or run the SCPI commands to enter the zero span mode.
- When you modify the span in non-zero span mode, both CF step and RBW will be changed automatically if they are in Auto mode. Besides, the change of RBW will change the value of VBW (in Auto VBW mode).
● Any variation in span, RBW, or VBW would cause a change in the sweep time. - You can use the numeric keys, the knob, and the arrow keys on the front panel to modify this parameter; also you can modify it on the touchscreen. For details, refer to descriptions in "Parameter Setting".
Table 2-6 Span
| Parameter | Remarks |
| Default | Fmax |
| Range[1] | 0 Hz, 100 Hz to Fmax |
| Unit | GHz, MHz, kHz, Hz |
| Knob Step | span > 0, step = span/200 |
| Left/Right Arrow Key Step | span = 0, step = 10Min = 2 Hz |
| Up/Down Arrow Key Step | at 1-2-5 step |
Note [1] : When the span of the analyzer is set to 0 Hz, the spectrum analyzer enters the zero span mode. If option RSA3000-BW1 is installed, the available range is from 10 Hz to Fmax in non-zero span.
Last Span
Sets the span to the previous span setting.
Full Span
Sets the maximum span.
Zero Span
Sets the span to 0 Hz. The values of start frequency and stop frequency are the same as that of the center frequency. The X-axis is time. The analyzer measures the time-domain characteristics of the amplitude at the center frequency point of the input signal.
Remarks:
The zero span mode displays the time-domain characteristics of the signal's fixed frequency components. Great differences can be found between the zero span and the non-zero span. The following functions are invalid in zero span.
● "Signal Track" under FREQ;
- "Mkr -> CF", "Mkr -> CF Step", "Mkr -> Start", "Mkr -> Stop", "Mkr Δ -> CF", and "Mkr Δ -> Span" under Marker To;
AMPT
Sets the amplitude parameters of the analyzer. You can modify these parameters to make the signals under test be displayed with minimal errors in the current window, easy for you to observe.
Ref Level
Sets the maximum power or voltage that can be displayed in the current window.
Remarks:
- As the RF link is limited by the maximum mixer level, when the attenuation is reduced, the reference level will be reduced to meet the limitation of the mixer level; when the attenuation is increased, the reference level will remain unchanged.
- You can use the numeric keys, the knob, and the arrow keys on the front panel to modify this parameter; also you can modify it on the touchscreen. For details, refer to descriptions in "Parameter Setting".
Table 2-7 Reference Level
| Parameter | Remarks |
| Default | 0 dBm |
| Range | -170 dBm to 30 dBm |
| Unit | dBm, -dBm, V, mV, uV |
| Knob Step | In Log scale mode, step = scale/10 |
| Left/Right Arrow Key Step | In Lin scale mode, step = 0.1 dBm |
| Up/Down Arrow Key Step | In Log scale mode, step = scale |
| In Lin scale mode, step = 1 dBm |
Attenuation
Sets the RF front-end attenuator to allow high-level signals to pass through the mixer with low distortion, and low-level signals to pass through the mixer with low noise.
Remarks:
- The attenuator consists of fixed attenuator and variable attenuator. The attenuation of the fixed attenuator is 20 dB, and the attenuation range of the variable attenuator is from 0 dB to 30 dB. Therefore, the input attenuation ranges from 0 dB to 50 dB.
- When the set attenuation amount is greater than 20 dB, fixed attenuator is preferred to be used by default.
- When the maximum mixer level and reference level are confirmed, the minimum of the input attenuation should meet the following equation:
ATT = L + a + a - L - L _ mixC 2-3
Wherein, ATTmin , LRef , aPA , aExt , LOffset , and Lmix indicate the minimum input attenuation, reference level, PA, external gain, reference level offset, and maximum mixer level, respectively.
- You can use the numeric keys, the knob, and the arrow keys on the front panel to modify this parameter; also you can modify it on the touchscreen. For details, refer to descriptions in "Parameter Setting".
Table 2-8 Input Attenuation
| Parameter | Remarks |
| Default | 10 dB |
| Range | 0 dB to 50 dB |
| Unit | dB |
| Knob Step | Preamp off, step = 1 dB |
| Left/Right Arrow Key Step | |
| Up/Down Arrow Key Step | 5 dB |
Atten Auto
Selects "Manual" or "Auto" to be the current attenuation mode.
Remarks:
- To select "Manual" to be the attenuation mode, press Attenuation to set the attenuation value, and the attenuation mode will be automatically switched to "Manual".
- When you select "Auto" to be the attenuation mode, the attenuator will automatically adjust the attenuation value to meet the current amplitude setting.
RF Preamp
Sets the RF front-end preamplifier to be on or off. When the signal under test is a low-level signal, turning on the preamplifier can reduce the displayed average noise level, so that you can distinguish low-level signals from the noise. By default, the preamp gain is 20 dB.
Y Axis Unit
Sets the unit of the Y-axis to dBm, dBmV, dBuV, Volts, or Watts. Wherein, dBm, dBmV, and dBuV are for Log scale; Volts and Watts are for Linear scale. The default unit is dBm.
Remarks:
The conversion relations between units are as follows:
= 1 0 ( Volts ^ 2R × I/0 . 0 0 1 W) 2-4
dBµV = 2 0 lg (Volts/1 µV) 2-5
dBmV = 2 0 lg ( Volts /1 mV) 2-6
Watts = Volts ^ 2R 2-7
Wherein, R denotes the reference resistance.
Scale Type
Sets the scale type of the Y-axis to Lin or Log. By default, it is Log.
Remarks:
- In Log scale type, the Y-axis denotes the logarithmic coordinate. The top line of the graticule is the reference level, and the scale per division represents the scale value. When the scale type is changed from Lin to Log, the unit of Y-axis will automatically switch to the default unit (dBm) in Log scale type.
- In Lin scale type, the Y-axis denotes the linear coordinate. The top line of the graticule is the reference level, and 0 V is at the bottom of the graticule. Each vertical division of the graticule represents one-tenth of the reference level. The scale setting function is invalid. When the scale type is changed from Log to Lin, the unit of Y-axis will automatically switch to the default unit (Volts) in Lin scale type.
● The scale type does not affect the unit of Y-axis. - If the "Normalize" function is enabled, "Log" is selected to be the scale type by default, and the scale type is grayed out and disabled.
Scale/Div
Sets the logarithmic units per vertical grid division on the display. This function is only available when the scale type is set to "Log".
Remarks:
● The amplitude range to be displayed can be adjusted by setting the scale.
● The range of the signal amplitude that can be displayed is as follows:
Minimum: reference level - (10 × current scale value)
Maximum: reference level
- You can use the numeric keys, the knob, and the arrow keys on the front panel to modify this parameter; also you can modify it on the touchscreen. For details, refer to descriptions in "Parameter Setting".
Table 2-9 Scale
| Parameter | Remarks |
| Default | 10 dB |
| Range | 0.1 dB to 20 dB |
| Unit | dB |
| Knob Step | scale ≥ 1, step = 1 dB |
| Left/Right Arrow Key Step | scale < 1, step = 0.1 dB |
| Up/Down Arrow Key Step | at 1-2-5 step |
Max Mixer Lvl
Sets the maximum input level of the mixer according to the amplitude of the signal.
Remarks:
- For the high-level input signal, select a smaller maximum mixer level to increase the input attenuation and reduce the distortion of the signal; for the low-level input signal, select a larger maximum mixer level to reduce the input attenuation and noise.
- You can use the numeric keys, the knob, and the arrow keys on the front panel to modify this parameter; also you can modify it on the touchscreen. For details, refer to descriptions in "Parameter Setting".
Table 2-10 Maximum Mixing Level
| Parameter | Remarks |
| Default | -10 dBm |
| Range | -50 dBm to -10 dBm |
| Unit | dBm, -dBm, mV, uV |
| Knob Step | 1 dBm |
| Left/Right Arrow Key Step | |
| Up/Down Arrow Key Step | 5 dBm |
Ref Offset
Adds an offset value to the reference level to compensate for gains or losses generated between the DUT and the analyzer input.
Remarks:
- The offset value does not affect the trace position, but will modify the reference level readout and the marker amplitude readout.
- You can use the numeric keys, the knob, and the arrow keys on the front panel to modify this parameter; also you can modify it on the touchscreen. For details, refer to descriptions in "Parameter Setting".
Table 2-11 Reference Level Offset
| Parameter | Remarks |
| Default | 0 dB |
| Range | -300 dB to 300 dB |
| Unit | dB |
| Knob Step | 1 dB |
| Left/Right Arrow Key Step | |
| Up/Down Arrow Key Step | 5 dB |
Sweep and Function Settings
BW
Sets the parameters such as RBW (Resolution Bandwidth) and VBW (Video Bandwidth).
RBW
Sets the resolution bandwidth (RBW) to distinguish two signals whose frequencies are close with each other.
Remarks:
- Reducing RBW can gain a higher frequency resolution, but will also prolong the sweep time (when sweep time is set to Auto, it will be affected by both RBW and VBW).
- You can use the numeric keys, the knob, and the arrow keys on the front panel to modify this parameter; also you can modify it on the touchscreen. For details, refer to descriptions in "Parameter Setting".
Note: When "Detector Type" is "Quasi Peak", or the "Filter Type" is "EMC", the available values of RBW can only be 200 Hz, 9 kHz, 120 kHz, or 1 MHz.
Table 2-12 RBW
| Parameter | Remarks |
| Default | 3 MHz |
| Range[1] | 10 Hz to 3 MHz |
| Unit | GHz, MHz, kHz, Hz |
| Knob Step | at 1-3-10 step |
| Left/Right Arrow Key Step | |
| Up/Down Arrow Key Step | at 1-3-10 step |
Note [1] : If option RSA3000-BW1 is installed, the available range is from 1 Hz to 10 MHz.
RBW Mode
Sets the coupling mode of RBW.
Remarks:
- When you set RBW Mode to "Auto", RBW is in auto coupling state. Its value changes with the span (non-zero span), and the value is determined by span/RBW ratio. You can set RBW Mode to "Manual" or directly set the RBW value to change the coupling mode.
- When you perform the Preset operation, the coupling state is Auto.
- In zero span mode, RBW Mode is, by default, set to "Manual".
SPAN/RBW Ratio
Sets the ratio of span to RBW. You can use the numeric keys, the knob, and the arrow keys on the front panel to modify this parameter; also you can modify it on the touchscreen. For details, refer to descriptions in "Parameter Setting".
Table 2-13 Span/RBW Ratio
| Parameter | Remarks |
| Default | 106 |
| Range | 2 to 10,000 |
| Unit | None |
| Knob Step | at 1-2-5 step |
| Left/Right Arrow Key Step | |
| Up/Down Arrow Key Step | at 1-2-5 step |
SPAN/RBW Mode
Sets the coupling mode of the Span/RBW ratio.
Remarks:
- When you set SPAN/RBW Mode to "Auto", "SPAN/RBW Ratio" is in auto coupling state, and its value is 106. You can set SPAN/RBW Mode to "Manual" or directly set the SPAN/RBW ratio to change the coupling mode.
- When you perform the Preset operation, the coupling state is Auto.
- In zero span mode, the SPAN/RBW Mode menu item cannot be set.
VBW
Sets the video bandwidth (VBW) to filter out the noises outside the video band.
Remarks:
- Reducing VBW makes the spectral line smoother, so that the low-level signal in the noise can be detected, but this will also prolong the sweep time (when sweep time is set to Auto, it will be affected by both RBW and VBW).
- You can use the numeric keys, the knob, and the arrow keys on the front panel to modify this parameter; also you can modify it on the touchscreen. For details, refer to descriptions in "Parameter Setting".
Table 2-14 VBW
| Parameter | Remarks |
| Default | 3 MHz |
| Range | 1 Hz to 10 MHz |
| Unit | GHz, MHz, kHz, Hz |
| Knob Step | at 1-3-10 step |
| Left/Right Arrow Key Step | |
| Up/Down Arrow Key Step | at 1-3-10 step |
VBW Mode
Sets the coupling mode of the Span/RBW ratio.
Remarks:
- When you set VBW Mode to "Auto", VBW is in auto coupling state. Its value changes with the RBW, and the value is determined by VBW/RBW ratio. You can set VBW Mode to "Manual" or directly set the VBW value to change the coupling mode.
- When you perform the Preset operation, the coupling state is Auto.
VBW/RBW Ratio
Sets the ratio of VBW to RBW.
Remarks:
● This value is different for different kinds of signals.
Sine signal: 1 to 3 (for faster sweeps)
Pulse signal: 10 (to reduce the impact on the amplitude of transient signals)
Noise signal: 0.1 (to obtain the average of noises)
- You can use the numeric keys, the knob, and the arrow keys on the front panel to modify this parameter; also you can modify it on the touchscreen. For details, refer to descriptions in "Parameter Setting".
Table 2-15 VBW/RBW Ratio
| Parameter | Remarks |
| Default | 1 |
| Range | 0.00001 to 3,000,000 |
| Unit | None |
| Knob Step | at 1-3-10 step |
| Left/Right Arrow Key Step | |
| Up/Down Arrow Key Step | at 1-3-10 step |
VBW/RBW Mode
Sets the coupling mode of the VBW/RBW ratio.
Remarks:
- When you set VBW/RBW Mode to "Auto", "VBW/RBW Ratio" is in auto coupling state, and its value is determined by auto rule value. You can set VBW/RBW Mode to "Manual" or directly set the VBW/RBW ratio to change the coupling mode.
- When you perform the Preset operation, the coupling state is Auto.
Filter Type
Sets the type of the RBW filter.
Remarks:
● RSA3000 supports two kinds of RBW filters: Gaussian (-3 dB) or EMC (-6 dB)
- When EMC filter is selected currently, the available RBW can only be 200 Hz, 9 kHz, 120 kHz, or 1 MHz.
- By default, the analyzer uses the Gaussian filter. If the detector type is "Quasi-peak", then the analyzer automatically switches to EMI filter.
Sweep
Sets sweep-related parameters, such as sweep time, sweep points, and sweep mode.
Sweep Points
Sets the number of points acquired in each sweep, i.g. the number of the trace points.
Remarks:
- With the increase of the sweep points, the frequency resolution of the marker will increase with it, but the sweep speed will decrease with it.
- Due to the limitation of the minimum interval of sweep points, when the number of sweep points is increased, the sweep time will be prolonged.
- Changing the number of the sweep points will affect multiple parameters of the system. Therefore, the system will make a new sweep and measurement again.
- You can use the numeric keys, the knob, and the arrow keys on the front panel to modify this parameter; also you can modify it on the touchscreen. For details, refer to descriptions in "Parameter Setting".
Table 2-16 Number of Sweep Points
| Parameter | Remarks |
| Default | 801 |
| Range | 101 to 10,001 |
| Unit | None |
| Knob Step | 1 |
| Left/Right Arrow Key Step | |
| Up/Down Arrow Key Step | 5 |
Sweep Time
Sets the time required for the spectrum analyzer to complete one sweep operation within the span range.
Remarks:
- You can use the numeric keys, the knob, and the arrow keys on the front panel to modify this parameter; also you can modify it on the touchscreen. For details, refer to descriptions in "Parameter Setting".
- When RBW is smaller than 1 kHz, the spectrum analyzer starts to perform FFT sweeps. At this time, the Sweep Time menu is disabled and grayed out.
Table 2-17 Sweep Time
| Parameter | Remarks |
| Default | 1 ms |
| Range[1] | 1 μs to 6,000 s |
| Unit | s, ms, μs, ns, ps |
| Knob Step | sweep time/100, Min = 1 μs |
| Left/Right Arrow Key Step | |
| Up/Down Arrow Key Step | at 1-1.5-2-3-5-7.5 step |
Note [1] : The range is from 1 ms to 4,000 s in non-zero span.
Sweep Time Mode
Sets the "Sweep Time" to be "Auto" or "Manual". By default, it is "Auto".
Remarks:
- In non-zero span mode, the analyzer selects the shortest sweep time based on the current RBW and VBW settings if "Auto" is selected.
● Decreasing the sweep time can speed up the measurement. However, an error may be caused if the set sweep time is less than the minimum sweep time in Auto coupling. At this point, "UNCAL" is shown in the status bar on the screen. - In zero span mode, the Sweep Time Mode menu is disabled and grayed out. When the system exits the zero span mode, the auto sweep coupling mode will restore to its previous state.
- When RBW is smaller than 1 kHz, the spectrum analyzer starts to perform FFT sweeps. At this time, the Sweep Time menu is disabled and grayed out.
Sweep Time Rule
Sets the sweep type to "Norm" or "Accy". The sweep will be faster if "Norm" is selected; while in "Accy" type, a higher measurement precision can be obtained. When RBW is smaller than 1 kHz, the spectrum analyzer starts to perform FFT sweeps. At this time, the Sweep Time menu is disabled and grayed out.
Continue
Sets the sweep mode to be continuous.
Remarks:
- If the instrument is in single sweep mode and no measurement function is enabled, press this key to enter continuous sweep mode. In this case, if the trigger conditions are met, the instrument will sweep continuously.
- If the instrument is in single sweep mode and the measurement function is
enabled, press this key to enter continuous sweep mode. In this case, if the trigger conditions are met, the instrument will sweep continuously.
- In continuous sweep mode, the system will send a trigger initialization signal automatically and enter the trigger condition judgment directly after each sweep is completed.
![graph TD A["Select "Cont""] --> B{Single sweep status?} B -->|Y| C["Enter continuous sweep mode and wait for trigger condition"] B -->|N| D["Sweep again and wait for trigger condition"]](/content/2026/07/1497176/images/955b41bc992f9770125427b84bc45cc7d9f44bb105ff0a28fa419584e384b921.jpg)
Figure 2-2 Process of Continuous Sweep
Single
Sets the sweep mode to be single. Selects "Single", and then the Single key on the front panel is illuminated.
In single sweep mode, press Single under Sweep menu or press Single directly on the front panel to perform one measurement.
Remarks:
- If the instrument is in continuous sweep mode and no measurement function is enabled, press this key to enter single sweep mode. In this case, if the trigger conditions are met, the instrument will execute the specified number of sweeps. (Note: In Average, Max Hold, and Min Hold modes, when performing the single measurement, the instrument will not stop sweeping until the sweep count has reached N. Wherein, N is determined by the average count of the current measurement.)
- If the instrument is in continuous sweep mode and the measurement function is enabled, press this key to set the measurement mode to "Single". In this case, if the trigger conditions are met, the instrument will execute the specified number of measurements.
- If the system is already in single sweep mode, press this key and then the system will execute the specified number of sweeps (or measurements) once the trigger conditions are met.
- In single sweep mode, trigger initialization (press Sweep → Single or send the
":INIT" command through the remote interface) should be executed before judging the trigger conditions.
![graph TD A["Press "Single""] --> B{Measurement status?} B -->|N| C["Single sweep mode?"] B -->|Y| D["Wait for trigger condition and make single measurement again"] C --> E["Enter single sweep mode and wait for trigger condition"] C --> F["Sweep again and wait for trigger condition"] D -->…](/content/2026/07/1497176/images/26596ea6fd5e350a5016b29ced710c09c27fc2e8e0ca8d12c9c892bcfebdc3d3.jpg)
Figure 2-3 Process of Single Sweep
Trigger
Selects the trigger source and sets trigger-related parameters.
Trigger Source
Sets "Free Run", "External 1", "External 2", or "Video" to be the trigger source.
1. Free Run
The trigger conditions are met at any time, that is, the analyzer generates trigger signals continuously.
2. External 1
In this mode, an external signal is input via the [TRIGGER IN] connector on the rear panel. When the signal meets the set trigger conditions, trigger signals are generated.
3. External 2
Press Input Output → Ext Trigger2 to select "In". Then, an external signal is input via the [TRIGGER IN/OUT] connector on the rear panel. When the signal meets the set trigger conditions, trigger signals are generated.
Note: For the external trigger interface, the input signal frequency shall not exceed 1 MHz.
4. Video
A trigger signal will be generated when the system detects a video signal whose voltage exceeds the specified video trigger level.
Note: This trigger type is available in either of the following conditions:
1) in non-zero span mode
2) when "Average(RMS)" or "Average(Vol)" is selected for the detector type.
Slope
Sets the trigger polarity for External Trigger. It is set positive to trigger on a rising edge and negative to trigger on a falling edge.
Trigger Delay Switch
Enables or disables the trigger delay function. After the trigger delay function is enabled, you can set the trigger delay time.
Trig Delay
Sets the time interval during which the instrument waits to start the sweep operation after the trigger signal that meets the trigger conditions is generated. You can use the numeric keys, the knob, and the arrow keys on the front panel to modify this parameter; also you can modify it on the touchscreen. For details, refer to descriptions in "Parameter Setting".
Table 2-18 Trigger Delay
| Parameter | Remarks |
| Default | 1 μs |
| Range | 0 μs to 500 ms |
| Unit | s, ms, μs, ns, ps |
| Knob Step | trigger delay/100, Min = 1 μs |
| Left/Right Arrow Key Step | |
| Up/Down Arrow Key Step | at 1-1.5-2-3-5-7.5 step |
Trigger Level
Sets the trigger level in video trigger. At this time, the trigger level line and the trigger level value are displayed on the screen.
Remarks:
- When the video trigger signal is not within the display range, the trigger level line is displayed at the top or bottom of the waveform display area.
- You can use the numeric keys, the knob, and the arrow keys on the front panel to modify this parameter; also you can modify it on the touchscreen. For details, refer to descriptions in "Parameter Setting".
Table 2-19 Trigger Level
| Parameter | Remarks |
| Default | -25 dBm |
| Range | -140 dBm to +30 dBm |
| Unit[1] | dBm |
| Knob Step | 1 dBm |
| Left/Right Arrow Key Step | |
| Up/Down Arrow Key Step | 10 dBm |
Note [1] : It is related to the specified unit of Y-axis.
Trigger Holdoff Switch
Turns on or off the trigger holdoff function.
Trigger Holdoff
Sets the holdoff time between trigger signals. You can use the numeric keys, the knob, and the arrow keys on the front panel to modify this parameter; also you can modify it on the touchscreen. For details, refer to descriptions in "Parameter Setting".
When the trigger conditions are met, the trigger occurs. Then, the delay begins, and the holdoff time begins. During the holdoff time, new trigger signals will be ignored. For a free-running trigger, the holdoff value is the minimum time between two trigger signals.
Table 2-20 Trigger Holdoff Time
| Parameter | Remarks |
| Default | 100 ms |
| Range | 100 μs to 500 ms |
| Unit | s, ms, μs, ns, ps |
| Knob Step | sync holdoff time/100, Min = 1 μs |
| Left/Right Arrow Key Step | |
| Up/Down Arrow Key Step | at 1-1.5-2-3-5-7.5 step |
Auto Trig Switch
Enables or disables the auto trigger function.
Auto Trig
Sets the time that the instrument will wait for the trigger conditions to be met. When the set waiting time times out, the instrument will not wait and start to initiate the sweep measurement.
Table 2-21 Auto Trigger Time
| Parameter | Remarks |
| Default | 100 ms |
| Range | 1 ms to 100 s |
| Unit | s, ms, μs, ns, ps |
| Knob Step | auto trigger time/100, Min = 1 μs |
| Left/Right Arrow Key Step | |
| Up/Down Arrow Key Step | at 1-1.5-2-3-5-7.5 step |
The relationship among the relevant parameters concerning trigger is shown in the following figure.
![graph TD A["trigger signal"] --> B["trigger on the rising edge"] C["sweep measurement1"] --> D["trigger occurs"] D --> E["auto trig"] E --> F["trigger d elay"] G["sweep measurement2 (turn off trigger delay)"] --> H["trigger holds holdoff"] H --> I["... ..."] style A fill:#f9f,stroke:#333 style C fil…](/content/2026/07/1497176/images/0ef7a05d5ab54f5426ed399e8ba70b883e57ad93a6dbba059d1dca48ec0ae8e8.jpg)
Figure 2-4 Trigger Parameter Relationship
Trace
Displays the sweep signal on the screen. Press Trace to set parameters for trace.
Trace Selection
RSA3000 can display at most 6 traces synchronously. Each trace is indicated in different colors (Trace1-yellow, Trace2-dark blue, Trace3-green, Trace4-purple, Trace5-light blue, Trace6-orange). For details, refer to the notes about "trace indicator" in "User Interface".
Select the corresponding trace to set the relevant parameters for the specified trace. By default, Trace1 is selected, and the trace type is "Clear Write".
Note: The trace currently displayed on the screen can be saved to the internal or external memory. If needed, you can recall it at any time. Press Save to save it according to descriptions in "Save".
Trace Type
Sets the type of the currently selected trace. The system calculates the sampled data by a specific operation method according to the selected trace type. The results will not be displayed unless you set "Trace Update" and "Trace Display" to "On". Trace types include Clear Write, Average, Max Hold, and Min Hold.
1. Clear Write
Sets the trace data to a minimum value, and displays the real-time sweep data of each point on the trace.
2. Average
Displays an average trace, which is represented by averaging the data of each point on the trace. The type of the trace is displayed to be smooth.
3. Max Hold
Maintains and displays a max hold trace, which represents the maximum data value on a point-by-point basis. When a new maximum value is generated, data will be updated, and the newly updated maximum value prevails.
4. Min Hold
Maintains and displays a min hold trace, which represents the minimum data value on a point-by-point basis. When a new minimum value is generated, data will be updated, and the newly updated minimum value prevails.
Detector Type
Sets the detector for the current measurement. The selected detector can be applied to the selected trace. The available trace detectors include Pos Peak, Neg Peak, Normal, Sample, Average (RMS), and Average (Vol).
1. Pos Peak
For each trace point, Positive Peak detector displays the maximum value of data sampled within the corresponding time interval.
2. Neg Peak
For each trace point, Negative Peak detector displays the minimum value of data sampled within the corresponding time interval.
3. Normal
Normal detector (also called Rosenfell detector) displays the maximum value and the minimum value of the sample data segment in alternating sequence. That is, for an odd-numbered data point, the minimum value of the sample data is displayed; for an even-numbered data point, the maximum value of the sample data is displayed. In this way, the amplitude variation range of the signal is clearly shown.
4. Sample
For each trace point, sample detector displays the transient level corresponding to the central time point of the corresponding time interval. This detector type is applicable to noise or noise-like signal.
5. Average (RMS)
For each data point, perform mean square root operation (see equation (2-8) of the sampled data within the corresponding time interval and display the result. In this type, noise can be rejected and weak signals can be clearly observed.
V = √ 1/N × _ i = 1 ^ N v _ iRN ^ 2 2-8
Wherein, VRMS is the root mean square value of voltage, expressed in V; N is the number of sampled values for each point displayed; vi is the envelope of the sampled value, expressed in V. Reference impedance R can be used to calculate power based on the formula: P = RMS2R .
6. Average (Vol)
For each data point, perform arithmetic averages (see equation below) on all the sampled data within the corresponding time interval and display the result.
V _ AV = 1/N × _ i = 1 ^ N v _ i 2-9
Wherein, VAV is the average of voltage in V; N is the number of sampled values for each point displayed; and vi is the envelop of the sampled value in V.
7. Quasi Peak (Option)
Quasi-peak detection is a weighted form of peak detection. For each data point, the detector detects the peak in the corresponding time interval, and uses quasi-peak detector circuit (containing specific charge and discharge structure) and the time constants specified in CISPR Publication 16 to make weighted calculation to display the weighted results. The quasi-peak detection is used for EMC test.
Note: The charge time for the quasi-detector is much shorter than the discharge time, which can not only reflects the amplitude of the signal, but also the time distribution of the signal.
Detector Auto
Enables or disables the Detector Auto function. By default, Detector Auto is enabled. If you set the detector type manually, please disable the Detector Auto function.
Trace Update
Enables or disables trace update.
Trace Display
Enables or disables the trace display.
Remarks:
- The trace state and the parameter settings for the corresponding state are as follows:
Active: Trace Update and Trace Display are "On".
View: Trace Update is "Off", and Trace Display is "On".
➢ Clear: Trace Update and Trace Display are "Off".
Back-end: Trace Update is "On", and Trace Display is "Off".
- In most cases, the inactive trace data keep unchanged. However, the data may be changed in the following conditions:
▶ Remotely write data into trace;
➢ Load the stored data to trace.
Trace data are cleared by the trace clear function.
- When inactive trace is displayed, the trace will not be zoomed in or out based on the setting of X-axis, but will move up and down based on the changes of Y-axis values.
- When the trace is shifted from inactive to active state, the trace is cleared, the average timer is reset, and a new sweep is restarted.
Math Function
Trace math functions perform mathematical operations between traces and, in some cases, user-defined offsets.
1. Op1-Op2
Calculates the power difference between Operand 1 (Op1) and Operand 2 (Op2), and saves it to the destination trace. During the sweep, the following formula is executed for each point:
result = / - ^ 1 0 (.) 2-10
In the above formula, the values of the trace points are in a decibel scale. If a point in Op1 is a maximum trace value, the difference (the result of the subtraction) is also a maximum trace value; if the difference is less than or equal to 0, the resultant point is the minimum trace value.
2. Op1+Op2
Calculates the power sum between Operand 1 (Op1) and Operand 2 (Op2), and saves it to the destination trace. During the sweep, the following formula is executed for each point:
_ result = / + Trace ^ / 1 0. ) (f) 2-11
In the above formula, the values of the trace points are assumed to be in a decibel scale. If a point in Op1 or Op2 is a maximum trace value, the sum (the result of addition) is also a maximum trace value.
3. Op1+Offset
Calculates the sum between Operand 1 (Op1) and the offset, and saves it to the destination trace. During the sweep, the following formula is executed for each point:
Trace _ result = Op1 + Offset 2-12
In the above formula, the parameter unit is dB.
4. Op1-Offset
Calculates the difference between Operand 1 (Op1) and the offset (Offset), and saves it to the destination trace. During the sweep, the following formula is executed for each point:
result = - Offset 2-13
In the above formula, the parameter unit is dB.
5. Op1-Op2+Ref
Operand 1 (Op1) minus Operand 2 (Op2), and then plus the reference (Reference). Then, saves the result to the destination trace. During the sweep, the following formula is executed for each point:
_ result = - + Reference 2-14
In the formula, the unit for Op1, Op2, and Reference is dBm.
6. Off
Disables the math function.
Note: The trace math functions are mutually exclusive. If you apply one math operation to a certain trace, the last selected math operation function should be disabled.
Op1
Selects Operand 1 to be used for the trace math functions. Operand 2 can be configured with Trace1, Trace2, Trace3, Trace4, Trace5, or Trace6.
Op2
Selects Operand 2 to be used for the trace math functions. Operand 2 can be configured with Trace1, Trace2, Trace3, Trace4, Trace5, or Trace6.
Note: The currently display trace does not involve in math operation.
Offset
Sets the log offset in the math operation function. The unit is dB.
Note: This menu is only valid when you select "Op1+Offset" or "Op1-Offset" to be the math type.
Table 2-22 Offset
| Parameter | Remarks |
| Default | 0 dB |
| Range | -100 dB to 100 dB |
| Unit | dB |
| Knob Step | 1 dB |
| Left/Right Arrow Key Step | |
| Up/Down Arrow Key Step | 10 dB |
Reference
Sets the log reference difference in the math operation function. The unit is dBm.
Note: This menu is only valid when you select the "Op1-Op2+Ref" operation function.
Table 2-23 Reference
| Parameter | Remarks |
| Default | 0 dB |
| Range | -170 dB to 30 dB |
| Unit | dB |
| Knob Step | 1 dB |
| Left/Right Arrow Key Step | |
| Up/Down Arrow Key Step | 5 dB |
Preset All
Turns on Trace 1, and blanks all other traces. This operation does not affect the trace type, trace detector, and other states.
Clear All
Clears all traces. All the trace data will be set to the minimum trace value (except the case that the trace is in Min Hold state). When the trace is in Min Hold state, the trace data will be set to the maximum trace value. That is, even if you turn off the trace update, the trace data will be updated after you perform the "Clear All" operation.
Tracking Generator
Sets the parameter related to the tracking generator (TG). This function is only available for RSA3045-TG/RSA3030-TG.
Tracking Generator
Enables or disables the tracking generator.
When the tracking generator is enabled, a signal with the same frequency as that of the current sweep signal will be output from the [GEN OUTPUT 50Ω] connector on the front panel. The power of the signal can be set through the menu.
Amplitude
Sets the output power of the tracking generator signal.
You can use the numeric keys, the knob, and the arrow keys on the front panel to modify this parameter; also you can modify it on the touchscreen. For details, refer to descriptions in "Parameter Setting".
Table 2-24 Tracking Generator Output Signal Amplitude
| Parameter | Remarks |
| Default | -40 dBm |
| Range | -40 dBm to 0 dBm |
| Unit | dBm, -dBm, mV, uV |
| Knob Step | 1 dBm |
| Left/Right Arrow Key Step | |
| Up/Down Arrow Key Step | 10 dBm |
Amplitude Offset
Sets the offset of the output power of the tracking generator when gains or losses occur between the TG output and external device, so as to display the actual power value.
Remarks:
- This parameter only changes the readout of the tracking generator output power, rather than the actual output power.
- The offset could be either a positive (gain in the external output) or a negative (loss in the external output) value.
- You can use the numeric keys, the knob, and the arrow keys on the front panel to modify this parameter; also you can modify it on the touchscreen. For details, refer to descriptions in "Parameter Setting".
Table 2-25 Tracking Generator Output Amplitude Offset
| Parameter | Remarks |
| Default | 0 dB |
| Range | -200 dB to 200 dB |
| Unit | dB |
| Knob Step | 1 dB |
| Left/Right Arrow Key Step | |
| Up/Down Arrow Key Step | 10 dB |
Normalize
Before enabling the normalize function, connect the tracking generator output terminal [Gen Output 50Ω] to the RF input terminal [RF Input 50Ω].
Normalization can eliminate the error of tracking generator output amplitude.
Note: Only when Output under the TG menu is "On" and the current Y-axis scale is log, can the Normalize menu be enabled.
1. Normalize
Enables or disables the normalize function. If no saving operation is performed on the reference trace before enabling the normalize function, the next time you enable the function, the analyzer will save the reference trace automatically after it completes the current sweep. During saving the reference trace, a prompt message will be displayed. When the normalize function is enabled, the corresponding value of the reference trace will be subtracted from the trace data after every sweep.
2. Reference Level
After the normalize function is enabled, you can adjust the vertical position of the trace on the screen by adjusting the reference level.
- Different from the Ref Level sub-menu under AMPT, the parameter "Reference Level" under "Normalize" will not affect the reference level of the analyzer once it is modified.
- You can use the numeric keys, the knob, and the arrow keys on the front panel to modify this parameter; also you can modify it on the touchscreen. For details, refer to descriptions in "Parameter Setting".
Table 2-26 Normalization Reference Level
| Parameter | Remarks |
| Default | 0 dB |
| Range | -200 dB to 200 dB |
| Unit | dB |
| Knob Step | 1 dB |
| Left/Right Arrow Key Step | |
| Up/Down Arrow Key Step | 10 dB |
3. Reference Position
After the normalize function is enabled, you can adjust the vertical position of Reference Level on the screen by adjusting the reference position.
- The function of this menu is similar to that of Reference Level. When it is set to 0%, Reference Level is displayed at the bottom of the graticule and at the top line of the graticule when it is set to 100%.
- You can use the numeric keys, the knob, and the arrow keys on the front panel to modify this parameter; also you can modify it on the touchscreen. For details, refer to descriptions in "Parameter Setting".
Table 2-27 Tracking Generator Reference Position
| Parameter | Remarks |
| Default | 100% |
| Range | 0% to 100% |
| Unit | % |
| Knob Step | 1% |
| Left/Right Arrow Key Step | |
| Up/Down Arrow Key Step | 10% |
4. Reference Trace
Sets whether to display the reference trace. If you set "Reference Trace" to be "On", the reference trace saved (Trace 6) will be shown.
5. Save Ref Trace
Saves the data of Trace1 to Trace6 as the reference value for normalization. This operation should be done before you enable the normalize function.
Measurement Settings
Meas
Provides swept SA and VSWR, as well as multiple advanced measurement functions, including time-domain power, adjacent channel power, multi-channel power, occupied bandwidth, emission bandwidth, C/N ratio, harmonics, and TOI.
Swept SA
Measures with swept analysis (frequency-domain), FFT analysis (frequency-domain), or zero span analysis (time-domain).
After you select Swept SA, the advanced measurement function (AMK) is off by default. Press Meas Setup to set the corresponding parameters for swept SA.
Advanced Measurement Function (AMK)
This function is an option for RSA3000, and the function is only available when the advanced measurement kit (AMK) is installed. When you enable the measurement function, the screen is divided into two windows, with the upper window (the basic measurement window) displaying the sweep trace and the lower window displaying the measurement results.
1. Meas Off
Disables the advance measurement function and returns to the swept SA interface in GPSA mode.
2. T-Power
The system enters the zero span mode and calculates the power within the time domain. The available power types include Peak, Average, and RMS.
Select T-Power and then press Meas Setup to set the corresponding parameters.
3. ACP
Measures the power of the main channel, the power of adjacent channels, and the power difference between the main channel and each of the adjacent channels. When this function is enabled, the span and resolution bandwidth of the analyzer will be adjusted to smaller values automatically.
Select ACP and then press Meas Setup to set the corresponding parameters.
4. Multichan Pwr
Measures the power and power density of multiple channels or that of the specified channel bandwidth. When this function is enabled, the span and
resolution bandwidth of the analyzer will be adjusted to smaller values automatically.
Select Multichan Pwr and then press Meas Setup to set the corresponding parameters.
5. Occupied BW
Integrates the power within the whole span and then calculates the bandwidth occupied by this power according to the specified power ratio. The OBW function also indicates the difference (namely "Transmit Freq Error") between the center frequency of the channel and the center frequency of the analyzer. Select Occupied BW and then press Meas Setup to set the corresponding parameters.
6. Emission BW
Measures the bandwidth between two points on the signal which are X dB below the highest point within the span.
Selects Emission BW and then press Meas Setup to set the corresponding parameters.
7. C/N Ratio
Measures the power of the carrier and that of the noise with the specified bandwidth, as well as their power ratio.
Select C/N Ratio and then press Meas Setup to set the corresponding parameters.
8. Harmo Dist
Measures the power of each order of harmonic and THD (total harmonic distortion) of the carrier. The highest order of harmonics for measurement is 10. The fundamental harmonic amplitude of the carrier signal must be greater than -50 dBm; otherwise the measurement will be invalid.
Select Harmo Dist and then press Meas Setup to set the corresponding parameters.
9. TOI
Measures the third-order intercept (TOI) of a two-tone signal (with the same amplitude and similar frequency), including the frequencies and amplitudes of Lower Tone, Upper Tone, Lower 3rd TOI, and Upper 3rd TOI, as well as the intercept points of both the Lower 3rd TOI and Upper 3rd TOI.
Select TOI and then press Meas Setup to set the corresponding parameters. Restart
VSWR
Enables or disables the VSWR measurement function. When the VSWR measurement function is enabled, the user interface is divided into two sections automatically (the lower section provides the measurement wizard). At this time, you can perform the VSWR measurement according to the wizard. Press Meas Setup to set the corresponding parameters.
Tip:
The VSWR bridge and tracking generator are required in VSWR measurement. Therefore, this function is only available for RSA3045-TG/RSA3030-TG installed with VSWR bridge. When the VSWR measurement is enabled, the tracking generator is enabled automatically, and the backlight of TG on the front panel turns on.
Meas Setup
Open the parameter setting menu of the function selected in the Meas menu.
Swept SA
1. Avg Number
Specifies the number of counts (N) for Average, Max Hold, and Min Hold. For Average, the greater the value of N, the smoother the trace is displayed. In Average, Max Hold, and Min Hold modes, when performing the single measurement, the instrument stops sweeping after the sweep count has reached N.
Table 2-28 Swept SA Average Count
| Parameter | Remarks |
| Default | 100 |
| Range | 1 to 10,000 |
| Unit | None |
| Knob Step | 1 |
| Left/Right Arrow Key Step | |
| Up/Down Arrow Key Step | 1 |
2. Avg Mode
The average modes include "Log", "RMS", and "Scalar".
- Log: In this mode, all filtering and averaging processes select the log unit (dB). This average type is the most effective one for finding the low-level signal that is close to the noise amplitude. The formula is shown as follow:
NewAvg = - × + Newdata /k 2-15
In the above formula, the parameter unit is dB.
- RMS: In this mode, all filtering and averaging processes work on the power (the square of the amplitude) of the signal. This average type is best for measuring the true time average power of complex signals. The formula is shown as follows:
NewAvg = 1 0 ( (k - 1) × 1 0 ^ OldAvg /1 0 + 1 0 ^ Newdata /1 0k) 2-16
In the above formula, the parameter unit is dB.
- Scalar: In this mode, all filtering and averaging processes work on the voltage envelope of the signal. This average type is the most appropriate one for observing the great envelope fluctuations of AM or pulse-modulated signals such as radar and TDMA transmitters. The formula is shown as follows:
= 2 0 NewAvg - × OldAvg 2 0 + 1 0 1 0 ^ 3 9) (k)k 2-17
In the above formula, the parameter unit is dB.
3. Avg State
Enables or disables the auto average function. When the auto average function is enabled, the instrument will select the best average type based on the current settings. When you select one of the average types manually, the instrument will apply the selected type, and the auto average function is disabled automatically.
4. Limit
Sets the parameters of limit lines. After you press Preset, the limit line measurement function is disabled, but the data of the limit lines will be reserved. The limit line data will only be deleted when the loading mode is Default. When you exit the measurement mode, the limit line data will not be deleted.
1) Test Limits
Selects whether the displayed traces are tested against the corresponding limit lines. For each displayed trace, the corresponding limit line is turned on, and a message will be displayed at the upper-left corner of the trace to indicate whether the test passes or fails.
2) Select Limit
Selects the current limit line. By default, it is Limit1.
3) Limit State
Enables or disables the display of the limit line. When the limit line is on, the measurement interface displays the limit line, and the corresponding traces are tested based on the current limit lines. Each limit line is displayed in a different color.
4) Edit Limit
When "Display State" of the limit line is set to "On", this menu is valid. When you press this key to enter the editing menu, open the limit editing window. Then, the current limit line will be turned on. Close the peak table, and open the trace that corresponds to the limit line.
- Type: Selects the type of the current limit line to be "Upper" or "Lower". If the trace amplitude is greater than the amplitude of the upper limit line and smaller than that of the lower limit line, then the test fails.
- X To CF: When "Fixed" is selected, the frequency of the current editing point will not be affected by the center frequency. When "Relative" is selected, the frequency of the current editing point is the difference between the frequency of the point and the current center frequency. At this time, if the center frequency changes, then the position of the
current editing point changes along with the center frequency.
- Y To Ref: When "Fixed" is selected, the amplitude of the current editing point will not be affected by the reference level. When "Relative" is selected, the amplitude of the current editing point is the difference between the amplitude of the point and that of the current reference level. At this time, if the reference level changes, then the position of the current editing point changes along with the reference level.
- Margin State: Enables or disables the display of the margin. When you enable the display of the margin, the measurement interface displays the margin lines; when you disable the display of the margin, the margin is invalid.
● Margin: Sets the margin for the current limit line.
● Navigation: Selects the first line of the limit line table. - Frequency: Edits the frequency of the current point. When Rel Freq is selected, edit the frequency difference between the frequency of the current point and the center frequency.
- Amplitude: Edits the amplitude of the current point. If the Rel Ampt is enabled, edit the amplitude difference between the amplitude of the current point and the reference level.
- Append Point: Inserts an edit point.
- Delete Point: Deletes the point that you are editing.
- Build From: Sets a trace for building the limit line. The range is from Trace1 to Trace6.
● Build: Builds the limit line according to the selected trace. - Copy From: Copies the selected limit line into the current limit line. The range is from Limit1 to Limit6.
● Copy: Performs the limit line copy operation.
● X Offset: Sets the frequency offset of the current limit line.
● Y Offset: Sets the amplitude offset of the current limit line. - Apply Offset: Adds the X and Y offsets to each point of the current limit line, then resets the X and Y offset values to 0.
Tip: You can touch any point in the trace display window on the screen to edit the current point to be the limit line data point. You can also drag the point to adjust the position of the current edit point, that is, to change the frequency/amplitude of the current point.
5) Test Trace
Sets the trace for the current limit line test.
6) Delete Limit
Deletes the currently selected limit line. The data of the current limit line will be cleared and they will be restored to factory defaults.
7) Deletes All Limits
Deletes all limit lines. After you press the menu, the data of all the limit lines will be cleared and they will be restored to factory defaults.
5. Auto Couple
When you enable "Auto Couple" function, all the manual/auto settings in the current measurement mode will be set to "Auto". This operation does not affect other measurement modes.
In auto state, the auto coupled parameters are changed with their coupled parameters. The auto coupling operation will ensure the optimal performance of the instrument. After the operation, all the auto coupled parameters will immediately be automatically reset based on the coupled parameters.
6. Meas Preset
Restores all parameters of the current measurement mode to their factory default values.
Time-domain Power (T-Power)
Measurement Interface:

Figure 2-5 T-Power Measurement Interface
Measurement Result: T-power, i.g. the power of the signal from the start line to stop line.
Measurement Parameters: average count, average mode, average auto, power type, start line, and stop line.
1. Avg Number
Specifies the number of times for averaging the measurement results. You can use the numeric keys, the knob, or arrow keys to modify this parameter; you can also use the touch screen to modify the parameter.
Table 2-29 Average Count of T-Power Measurement
| Parameter | Remarks |
| Default | 10 |
| Range | 1 to 1,000 |
| Unit | None |
| Knob Step | 1 |
| Left/Right Arrow Key Step | |
| Up/Down Arrow Key Step | 1 |
2. Avg Mode
Sets the average mode to "Exponential" or "Repeat". The default average mode is "Exponential".
- When "Exponential" is selected, the result is the exponential average of the measurement results obtained in the past N times (N is specified in "Avg Number").
- When "Repeat" is selected, the result is the arithmetic average of the measurement results obtained in the past N times (N is specified in "Avg Number").
3. Avg State
Selects whether to auto averaging the measurement results. By default, it is set to "On".
4. TP Type
- Peak
Displays the power of the signal (with the maximum amplitude) between the start line and stop line. The detector type is set to "Pos Peak" automatically.
- Average
Displays the average power of signals between the start line and stop line. The detector type is set to "Voltage Avg" automatically.
• RMS
Displays the root mean square value (expressed in W) of the voltages of signals between the start line and stop line. The detector type is set to "RMS Avg" automatically.
5. Start Line
Sets the left margin (in time unit) of T-Power measurement. The calculation range for the data of T-Power measurement is from the start line to the stop line. You can use the numeric keys, the knob, or arrow keys to modify this parameter; you can also use the touch screen to modify the parameter.
Table 2-30 Start Line for T-Power Measurement
| Parameter | Remarks |
| Default | 0 μs |
| Range | 0 μs to (current value of stop line) |
| Unit | s, ms, μs, ns, ps |
| Knob Step | sweep time/600, Min = 1 μs |
| Left/Right Arrow Key Step | |
| Up/Down Arrow Key Step | at 1-1.5-2-3-5-7.5 step |
6. Stop Line
Sets the right margin (in time unit) of T-Power measurement. The calculation range for the data of T-Power measurement is from the start line to the stop line.
You can use the numeric keys, the knob, or arrow keys to modify this parameter; you can also use the touch screen to modify the parameter.
Table 2-31 Stop Line for T-Power Measurement
| Parameter | Remarks |
| Default | 1 ms |
| Range | current value of start line to current value of sweep time |
| Unit | s, ms, μs, ns, ps |
| Knob Step | sweep time/600, Min = 1 μs |
| Left/Right Arrow Key Step | |
| Up/Down Arrow Key Step | at 1-1.5-2-3-5-7.5 step |
7. Auto Couple
When you enable "Auto Couple" function, all the manual/auto settings in the current measurement mode will be set to "Auto".
In auto state, the auto coupled parameters are changed with their coupled parameters. The auto coupling operation will ensure the optimal performance of the instrument. After the operation, all the auto coupled parameters will immediately be automatically reset based on the coupled parameters.
8. Meas Preset
Restores all parameters of the current measurement mode to their factory default values.
ACP
Measurement Interface:

Figure 2-6 Adjacent Channel Power Measurement Interface
Measurement Results: main channel power, upper-adjacent channel power, and lower-adjacent channel power.
- Main channel power: displays the power within the bandwidth of the main channel.
● Upper: displays the power of the upper channel and the power difference between the upper channel and the main channel (in dBc).
● Lower: displays the power of the lower channel and the power difference between the lower channel and the main channel (in dBc).
Measurement Parameters: average count, average mode, auto average, main channel bandwidth, adjacent channel bandwidth, and channel spacing.
1. Avg Number
Specifies the number of times for averaging the measurement results. You can use the numeric keys, the knob, or arrow keys to modify this parameter; you can also use the touch screen to modify the parameter.
Table 2-32 Average Count of ACP Measurement
| Parameter | Remarks |
| Default | 10 |
| Range | 1 to 1,000 |
| Unit | None |
| Knob Step | 1 |
| Left/Right Arrow Key Step | |
| Up/Down Arrow Key Step | 1 |
2. Avg Mode
Sets the average mode to "Exponential" or "Repeat". The default average type is "Exponential".
- When "Exponential" is selected, the result is the exponential average of the measurement results obtained in the past N times (N is specified in "Avg Number").
- When "Repeat" is selected, the result is the arithmetic average of the measurement results obtained in the past N times (N is specified in "Avg Number").
3. Avg State
Selects whether to averaging the measurement results. By default, it is set to "On".
4. Main Chan BW
Sets the bandwidth of the main channel, and the power of the main channel is the power integral within this bandwidth. You can use the numeric keys, the knob, or arrow keys to modify this parameter; you can also use the touch screen to modify the parameter.
Table 2-33 Main Channel Bandwidth for ACP Measurement
| Parameter | Remarks |
| Default | 2 MHz |
| Range[1] | 33 Hz to 1.5 GHz |
| Unit | GHz, MHz, kHz, Hz |
| Knob Step | main channel bandwidth/100, Min = 1 Hz |
| Left/Right Arrow Key Step | |
| Up/Down Arrow Key Step | at 1-1.5-2-3-5-7.5 step |
Note [1] : If option RSA3000-BW1 is installed, the available range is from 3 Hz to 1.5 GHz.
5. Adj Chan BW
Sets the frequency width of the adjacent channels.
- The adjacent channel bandwidth is related to the main channel bandwidth, and the settable range is from (main channel bandwidth/20) to (main channel bandwidth x 20).
● You can use the numeric keys, the knob, or arrow keys to modify this
parameter; you can also use the touch screen to modify the parameter.
Table 2-34 Adjacent Channel Bandwidth for ACP Measurement
| Parameter | Remarks |
| Default | 2 MHz |
| Range[1] | 33 Hz to 1.5 GHz |
| Unit | GHz, MHz, kHz, Hz |
| Knob Step | adjacent channel bandwidth/100, Min = 1 Hz |
| Left/Right Arrow Key Step | |
| Up/Down Arrow Key Step | at 1-1.5-2-3-5-7.5 step |
Note [1] : If option RSA3000-BW1 is installed, the available range is from 3 Hz to 1.5 GHz.
6. Chan Spacing
Sets the spacing between the center frequency of the main channel and that of the adjacent channels.
- Adjusting this parameter will also adjust the distance between the upper/lower channel and the main channel.
- You can use the numeric keys, the knob, or arrow keys to modify this parameter; you can also use the touch screen to modify the parameter.
Table 2-35 Channel Spacing for ACP Measurement
| Parameter | Remarks |
| Default | 2 MHz |
| Range[1] | 33 Hz to 1.5 GHz |
| Unit | GHz, MHz, kHz, Hz |
| Knob Step | channel spacing/100, Min = 1 Hz |
| Left/Right Arrow Key Step | |
| Up/Down Arrow Key Step | at 1-1.5-2-3-5-7.5 step |
Note [1] : If option RSA3000-BW1 is installed, the available range is from 3 Hz to 1.5 GHz.
For details about the Auto Couple and Meas Preset menus, refer to their descriptions on Page 2-44.
Multichan Pwr
Measurement Interface:

Figure 2-7 Multi-channel Power Measurement Interface
Measurement Results: channel power and power spectral density
● Channel Power: power within the channel span.
● Power Spectral Density: power (in dBm/Hz) normalized to 1 Hz within the channel span.
Measurement Parameters: average count, average mode, auto average, channel frequency, and channel span.
1. Avg Number
Specifies the number of times for averaging the measurement results. You can use the numeric keys, the knob, or arrow keys to modify this parameter; you can also use the touch screen to modify the parameter.
Table 2-36 Average Count for Multi-channel Power Measurement
| Parameter | Remarks |
| Default | 10 |
| Range | 1 to 1,000 |
| Unit | None |
| Knob Step | 1 |
| Left/Right Arrow Key Step | |
| Up/Down Arrow Key Step | 1 |
2. Avg Mode
Sets the average mode to "Exponential" or "Repeat". The default average mode is "Exponential".
- When "Exponential" is selected, the result is the exponential average of the measurement results obtained in the past N times (N is specified in "Avg Number").
- When "Repeat" is selected, the result is the arithmetic average of the measurement results obtained in the past N times (N is specified in "Avg Number").
3. Avg State
Selects whether to averaging the measurement results. By default, it is set to "On".
4. Edit Channel
1) Channel Sheet
Opens or closes the channel editing table. When you select "On", the screen is split into two sections. The left section displays a channel editing table, and the right section displays the traces.
2) Navigations
Selects the first line of the channel editing table.
Note that when you select "Off" under Channel Sheet, this menu is invalid.
3) Channel Frequency
- In the channel editing table, when a channel is selected, this menu displays the center frequency of the selected channel. If you modify the frequency at this time, the center frequency of the corresponding selected channel will be updated at the same time.
- When no channel is selected in the channel editing table, this menu displays the center frequency of the last selected channel. At this time, you can set the center frequency of the channel according to your needs, and then press Add Channel to add a channel.
4) Channel Span
Sets the frequency width of the channel to be tested, and the power of the channel is the power integral within this bandwidth. You can use the numeric keys, the knob, or arrow keys to modify this parameter; you can also use the touch screen to modify the parameter.
- In the channel editing table, when a channel is selected, this menu displays the channel span of the selected channel. If you modify the span at this time, the span of the corresponding selected channel will be updated at the same time.
- When no channel is selected in the channel editing table, this menu displays the span of the last selected channel. At this time, you can set
the span of the channel according to your needs, and then press Add Channel to add a channel.
Table 2-37 Channel Span
| Parameter | Remarks |
| Default | 4.5 GHz |
| Range[1] | 100 Hz to 2*Min[(channel frequency - start frequency), (stop frequency - channel frequency)] |
| Unit | GHz, MHz, kHz, Hz |
| Knob Step | channel span/100, Min = 1 Hz |
| Left/Right Arrow Key Step | |
| Up/Down Arrow Key Step | at 1-1.5-2-3-5-7.5 step |
Note [1] : If option RSA3000-BW1 is installed, its minimum value can be set to 10 Hz.
5) Add Channel
- If a channel is selected in the table editing table, pressing this key can add a channel that is the same as the selected channel to the table.
- When no channel is selected in the channel editing table, pressing this key can add a channel whose center frequency is the same as the value under Channel Freq and whose span is the same as the value under Channel Span.
Note that when you select "Off" under Channel Sheet, this Add Channel menu is also valid.
6) Delete Channel
Press this key to delete the currently selected channel.
Note that when you select "Off" under Channel Sheet or no channel is selected, this Delete Channel menu is invalid.
7) Deletes All Channels
Press Del All Channel to clear data in the channel editing table, i.g. deleting all the channels.
Note that when you select "Off" under Channel Sheet, this Del All Channel menu is also valid.
For details about the Auto Couple and Meas Preset menus, refer to their descriptions on Page 2-44.
Occupied BW
Measurement Interface:

Figure 2-8 OBW Measurement Interface
Measurement Results: occupied bandwidth and transmit frequency error.
- OBW: Use the integral calculation method to calculate the power within the whole span, and then calculate the bandwidth occupied by the power based on the specified power ratio.
● Transmit Frequency Error: indicates the difference between the center frequency of the channel and that of the spectrum analyzer.
Measurement Parameters: average count, average mode, auto average, max hold, span, and power ratio.
1. Avg Number
Specifies the number of times for averaging the measurement results. You can use the numeric keys, the knob, or arrow keys to modify this parameter; you can also use the touch screen to modify the parameter.
Table 2-38 Average Count for OBW Measurement
| Parameter | Remarks |
| Default | 10 |
| Range | 1 to 1000 |
| Unit | None |
| Knob Step | 1 |
| Left/Right Arrow Key Step | |
| Up/Down Arrow Key Step | 1 |
2. Avg Mode
Sets the average mode to "Exponential" or "Repeat". The default average mode is "Exponential".
- When "Exponential" is selected, the result is the exponential average of the measurement results obtained in the past N times (N is specified in "Avg Number").
- When "Repeat" is selected, the result is the arithmetic average of the measurement results obtained in the past N times (N is specified in "Avg Number").
3. Avg State
Selects whether to averaging the measurement results. By default, it is set to "On".
4. Max Hold
Enables or disables max hold. By default, it is "Off".
- When Max Hold is enabled, each measurement result is compared with the previous result, and then display whichever is the maximum.
- When Max Hold is disabled, the current measurement result is displayed.
- Max Hold and average measurement mode are mutually exclusive. When Max Hold is enabled, the average measurement mode will be automatically disabled.
5. OBW Span
Sets the frequency range of integral calculation. The span is consistent with that of the spectrum analyzer. It is the frequency range of sweep. After it is set, the span of the spectrum analyzer will also be changed. You can use the numeric keys, the knob, or arrow keys to modify this parameter; you can also use the touch screen to modify the parameter.
Table 2-39 Span for OBW Measurement
| Parameter | Remarks |
| Default | 2 MHz |
| Range[1] | 100 Hz to 4.5 GHz |
| Unit | GHz, MHz, kHz, Hz |
| Knob Step | OBW span/100, Min = 1 Hz |
| Left/Right Arrow Key Step | |
| Up/Down Arrow Key Step | at 1-1.5-2-3-5-7.5 step |
Note [1] : If option RSA3000-BW1 is installed, the available range is from 10 Hz to 4.5 GHz.
6. Power Ratio
Sets the percentage the signal power takes up in the whole span power. You can use the numeric keys, the knob, or arrow keys to modify this parameter; you can also use the touch screen to modify the parameter.
Table 2-40 Power Ratio for OBW Measurement
| Parameter | Remarks |
| Default | 99% |
| Range | 1% to 99.99% |
| Unit | % |
| Knob Step | 0.01% |
| Left/Right Arrow Key Step | |
| Up/Down Arrow Key Step | 1% |
For details about the Auto Couple and Meas Preset menus, refer to their descriptions on Page 2-44.
Emission Bandwidth (EBW)
Measurement Interface:

Figure 2-9 EBW Measurement Interface
Measurement Results: EBW, i.g. the bandwidth between two points on the signal which are X dB below the highest point within the span. During the measurement, the analyzer first determines the frequency ( f0 ) of the maximum amplitude point within the span, and then finds the two frequency points ( f1 and f2 ) at the left and right side of f0 at which the signal amplitude is X dB below the maximum amplitude. The EBW equals to f2-f1.
Measurement Parameters: average count, average mode, auto average, max hold, span, and X dB.
1. Avg Number
Specifies the number of times for averaging the measurement results. You can use the numeric keys, the knob or arrow keys to modify this parameter.
Table 2-41 Average Count for EBW Measurement
| Parameter | Remarks |
| Default | 10 |
| Range | 1 to 1,000 |
| Unit | None |
| Knob Step | 1 |
| Left/Right Arrow Key Step | |
| Up/Down Arrow Key Step | 1 |
2. Avg Mode
Sets the average mode to "Exponential" or "Repeat". The default average mode is "Exponential".
- When "Exponential" is selected, the result is the exponential average of the measurement results obtained in the past N times (N is specified in "Avg Number").
- When "Repeat" is selected, the result is the arithmetic average of the measurement results obtained in the past N times (N is specified in "Avg Number").
3. Avg State
Selects whether to averaging the measurement results. By default, it is set to "On".
4. Max Hold
Enables or disables max hold. By default, it is "Off".
- When Max Hold is enabled, each measurement result is compared with the previous result, and then display whichever is the maximum.
- When Max Hold is disabled, the current measurement result is displayed.
- Max Hold and average measurement mode are mutually exclusive. When Max Hold is enabled, the average measurement mode will be automatically disabled.
5. EBW Span
This span is consistent with the span of the spectrum analyzer. It refers to the frequency range of the sweep. After it is set, the span of the spectrum analyzer will be modified accordingly. You can use the numeric keys, the knob, or arrow keys to modify this parameter; you can also use the touch screen to modify the parameter.
Table 2-42 Span for EBW Measurement
| Parameter | Remarks |
| Default | 2 MHz |
| Range[1] | 100 Hz to 4.5 GHz |
| Unit | GHz, MHz, kHz, Hz |
| Knob Step | EBW span/100, Min = 1 Hz |
| Left/Right Arrow Key Step | |
| Up/Down Arrow Key Step | at 1-1.5-2-3-5-7.5 step |
Note [1] : If option RSA3000-BW1 is installed, the available range is from 10 Hz to 4.5 GHz.
6. EBW X dB
Sets the value of X dB, which is used for EBW calculation. You can use the numeric keys, the knob, or arrow keys to modify this parameter; you can also use the touch screen to modify the parameter.
Table 2-43 X dB for EBW Measurement
| Parameter | Remarks |
| Default | -10 dB |
| Range | -100 dB to -0.1 dB |
| Unit | dB |
| Knob Step | 0.1 dB |
| Left/Right Arrow Key Step | |
| Up/Down Arrow Key Step | 1 dB |
For details about the Auto Couple and Meas Preset menus, refer to their descriptions on Page 2-44.
C/N Ratio (CNR)
Measurement Interface:

Figure 2-10 C/N Ratio Measurement Interface
Measurement Results: carrier power, noise power, and C/N ratio.
● Carrier Power: power within the carrier bandwidth.
● Noise Power: power within the noise bandwidth.
● C/N Ratio: the ratio of the carrier power to the noise power.
Measurement Parameters: average count, average mode, auto average, offset frequency, noise BW, and carrier bandwidth.
1. Avg Number
Specifies the number of times for averaging the measurement results. You can use the numeric keys, the knob, or arrow keys to modify this parameter; you can also use the touch screen to modify the parameter.
Table 2-44 Average Count for C/N Ratio Measurement
| Parameter | Remarks |
| Default | 10 |
| Range | 1 to 1,000 |
| Unit | None |
| Knob Step | 1 |
| Left/Right Arrow Key Step | |
| Up/Down Arrow Key Step | 1 |
2. Avg Mode
Sets the average mode to "Exponential" or "Repeat". The default average mode is "Exponential".
- When "Exponential" is selected, the result is the exponential average of the measurement results obtained in the past N times (N is specified in "Avg Number").
- When "Repeat" is selected, the result is the arithmetic average of the measurement results obtained in the past N times (N is specified in "Avg Number").
3. Avg State
Selects whether to averaging the measurement results. By default, it is set to "On".
4. Offset Freq
Sets the difference between the center frequency of the carrier and that of the noise. You can use the numeric keys, the knob, or arrow keys to modify this parameter; you can also use the touch screen to modify the parameter.
Table 2-45 Frequency Offset for C/N Ratio Measurement
| Parameter | Remarks |
| Default | 2 MHz |
| Range[1] | 33 Hz to 1.5 GHz |
| Unit | GHz, MHz, kHz, Hz |
| Knob Step | offset frequency/100, Min = 1 Hz |
| Left/Right Arrow Key Step | |
| Up/Down Arrow Key Step | at 1-1.5-2-3-5-7.5 step |
Note [1] : If option RSA3000-BW1 is installed, the available range is from 3 Hz to 1.5 GHz.
5. Noise BW
Sets the bandwidth of the noise to be measured. You can use the numeric keys, the knob, or arrow keys to modify this parameter; you can also use the touch screen to modify the parameter.
Table 2-46 Noise Bandwidth for C/N Ratio Measurement
| Parameter | Remarks |
| Default | 2 MHz |
| Range[1] | 33 Hz to 1.5 GHz |
| Unit | GHz, MHz, kHz, Hz |
| Knob Step | noise BW/100, Min = 1 Hz |
| Left/Right Arrow Key Step | |
| Up/Down Arrow Key Step | at 1-1.5-2-3-5-7.5 step |
Note [1] : If option RSA3000-BW1 is installed, the available range is from 3 Hz to 1.5 GHz.
6. Carrier BW
Sets the bandwidth of the carrier to be measured.
- The carrier bandwidth is related to the noise bandwidth, and the settable range is from (noise bandwidth/20) to (noise bandwidth x 20).
- You can use the numeric keys, the knob, or arrow keys to modify this parameter; you can also use the touch screen to modify the parameter.
Table 2-47 Carrier Bandwidth for C/N Ratio Measurement
| Parameter | Remarks |
| Default | 2 MHz |
| Range[1] | 33 Hz to 1.5 GHz |
| Unit | GHz, MHz, kHz, Hz |
| Knob Step | carrier noise/100, Min = 1 Hz |
| Left/Right Arrow Key Step | |
| Up/Down Arrow Key Step | at 1-1.5-2-3-5-7.5 step |
Note [1] : If option RSA3000-BW1 is installed, the available range is from 3 Hz to 1.5 GHz.
For details about the Auto Couple and Meas Preset menus, refer to their descriptions on Page 2-44.
Harmo Dist (THD)
Measurement Interface:

Figure 2-11 Harmonic Distortion Measurement Interface
Measurement Results: The amplitude of each order of harmonic and THD (total harmonic distortion) of the carrier. At most, 10th-order harmonic can be measured. Measurement Parameters: average count, average mode, auto average, number of harmonics, and sweep time.
1. Avg Number
Specifies the number of times for averaging the measurement results. You can use the numeric keys, the knob, or arrow keys to modify this parameter; you can also use the touch screen to modify the parameter.
Table 2-48 Average Count for Harmo Dist Measurement
| Parameter | Remarks |
| Default | 10 |
| Range | 1 to 1,000 |
| Unit | None |
| Knob Step | 1 |
| Left/Right Arrow Key Step | |
| Up/Down Arrow Key Step | 1 |
2. Avg Mode
Sets the average mode to "Exponential" or "Repeat". The default average mode
is "Exponential".
- When "Exponential" is selected, the result is the exponential average of the measurement results obtained in the past N times (N is specified in "Avg Number").
- When "Repeat" is selected, the result is the arithmetic average of the measurement results obtained in the past N times (N is specified in "Avg Number").
3. Avg State
Selects whether to averaging the measurement results. By default, it is set to "On".
4. No. of Harmo
Sets the number of the harmonics to be measured. It is used to calculate the total harmonic distortion. You can use the numeric keys, the knob, or arrow keys to modify this parameter; you can also use the touch screen to modify the parameter.
Table 2-49 Number of Harmonics for Harmo Dist Measurement
| Parameter | Remarks |
| Default | 10 |
| Range | 2 to 10 |
| Unit | None |
| Knob Step | 1 |
| Left/Right Arrow Key Step | |
| Up/Down Arrow Key Step | 1 |
5. Harmonic ST
Sets the sweep time of the harmonic measurement, namely the sweep time of the spectrum analyzer. You can use the numeric keys, the knob, or arrow keys to modify this parameter; you can also use the touch screen to modify the parameter.
Table 2-50 Sweep Time for Harmo Dist Measurement
| Parameter | Remarks |
| Default | 1 ms |
| Range | 1 μs to 6 ks |
| Unit | s, ms, μs, ns, ps |
| Knob Step | 1 μs |
| Left/Right Arrow Key Step | |
| Up/Down Arrow Key Step | 100 μs |
For details about the Auto Couple and Meas Preset menus, refer to their descriptions on Page 2-44.
Third-order Intercept (TOI)
Measurement Interface:
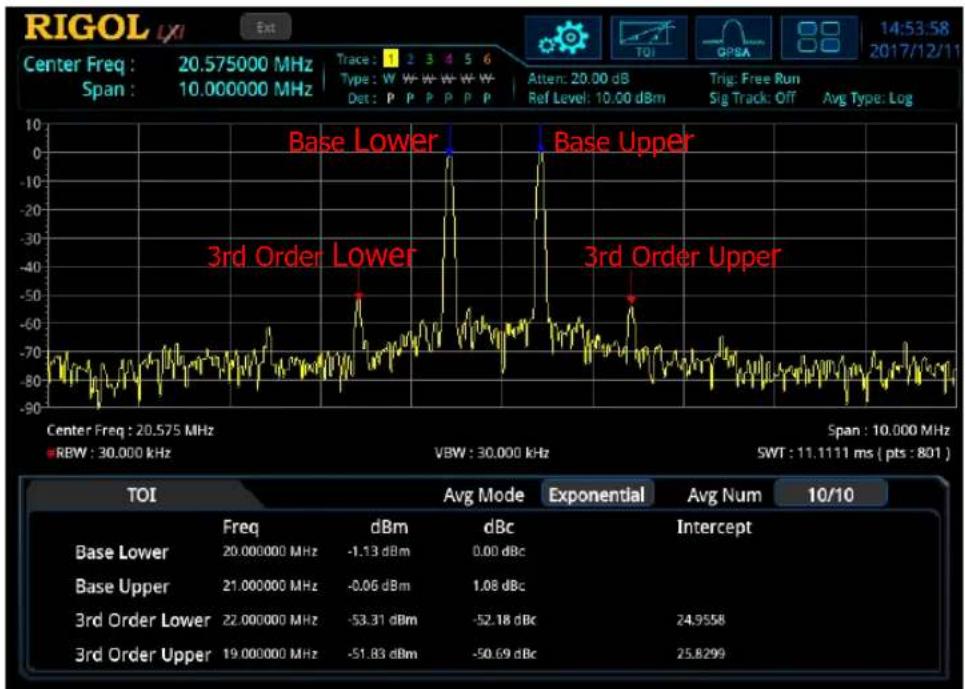
Figure 2-12 TOI Measurement Interface
Measurement Results:
Base Lower, Base Upper, 3rd Order Lower, 3rd Order Upper, frequency and amplitude of the above four signals, the amplitude difference between each signal and the base lower signal, as well as the 3rd order intercept point (Intercept) of the base lower signal and base upper signal.
3rd order lower intercept point = (power of base lower signal - power of 3rd order lower signal) + power of base lower signal; 3rd order upper intercept point = (power of base upper signal - power of 3rd order upper signal)/2 + power of base upper signal.
Measurement Parameters: average count, average mode, auto average, and span.
1. Avg Number
Specifies the number of times for averaging the measurement results. You can use the numeric keys, the knob, or arrow keys to modify this parameter; you can also use the touch screen to modify the parameter.
Table 2-51 Average Count for TOI Measurement
| Parameter | Remarks |
| Default | 10 |
| Range | 1 to 1,000 |
| Unit | None |
| Knob Step | 1 |
| Left/Right Arrow Key Step | |
| Up/Down Arrow Key Step | 1 |
2. Avg Mode
Sets the average mode to "Exponential" or "Repeat". The default average mode is "Exponential".
- When "Exponential" is selected, the result is the exponential average of the measurement results obtained in the past N times (N is specified in "Avg Number").
- When "Repeat" is selected, the result is the arithmetic average of the measurement results obtained in the past N times (N is specified in "Avg Number").
3. Avg State
Selects whether to averaging the measurement results. By default, it is set to "On".
4. TOI Span
This span is consistent with the span of the spectrum analyzer. It refers to the frequency range of the sweep. After it is set, the span of the spectrum analyzer will be modified accordingly. You can use the numeric keys, the knob, or arrow keys to modify this parameter; you can also use the touch screen to modify the parameter.
Table 2-52 Span for TOI Measurement
| Parameter | Remarks |
| Default | 2 MHz |
| Range | 100 Hz to 4.5 GHz |
| Unit | GHz, MHz, kHz, Hz |
| Knob Step | TOI distortion span/100, Min = 1 Hz |
| Left/Right Arrow Key Step | |
| Up/Down Arrow Key Step | at 1-1.5-2-3-5-7.5 step |
Note [1] : If option RSA3000-BW1 is installed, the available range is from 10 Hz to 4.5 GHz.
For details about the Auto Couple and Meas Preset menus, refer to their descriptions on Page 2-44.
VSWR
Measurement Interface:

Figure 2-13 VSWR Measurement Interface
Measurement Results: return loss, reflection coefficient, and VSWR.
- Return loss: also called reflection loss. It is calculated according to the formula: = r / Pf ρc . Wherein, ) is return loss, Pi is incident power, and Pr is reflected power.
- Reflection coefficient: indicates the ratio of reflected voltage to the incident voltage.
- VSWR: indicates the ratio of maximum voltage to minimum voltage in standing wave pattern.
VSWR bridge and the tracking generator (RSA3045-TG/RSA3030-TG) are required during measurement. Two measurements have to be performed according to the measurement wizard at the lower section of the interface: measurement with the DUT disconnected (represented by Trace6) and measurement with the DUT connected (represented by Trace1). The return loss is determined by the difference (represented by the math trace) of the results of the two measurements. The reflection coefficient and VSWR are calculated according to the return loss.
1. Reset
Resets the VSWR measurement parameters to their default values.
2. Cal Open
After you disconnect the instrument, press this key, and then the instrument executes the first measurement. The measurement result is represented by Trace6.
3. VSWR
After you connect the instrument, press this key, and then the instrument executes the second measurement. The measurement result is represented by Trace1. At the same time, the analyzer calculates the difference (represented by the math trace) between the two measurement results. Then the return loss, reflection coefficient, and VSWR are calculated based on the difference.
4. Selected Marker
Select one of the eight markers. By default, Marker1 is selected. When a marker is selected, you can set its state. The selected marker is marked on the math trace. The measurement result at the current marker is displayed in the measurement wizard.
5. Marker Mode
Sets the type of the currently selected marker.
6. Marker Freq
Sets the frequency of the selected marker.
7. Ref Value
Sets the reference level to adjust the vertical position of the trace on the screen.
- Different from Ref Level under the AMPT menu, modifying this parameter does not affect the reference level of the analyzer.
- You can use the numeric keys, the knob, or arrow keys to modify this parameter; you can also use the touch screen to modify the parameter.
Table 2-53 VSWR Ref Value
| Parameter | Remarks |
| Default | 0 dB |
| Range | -200 dB to 200 dB |
| Unit | dB |
| Knob Step | 1 dB |
| Left/Right Arrow Key Step | |
| Up/Down Arrow Key Step | 10 dB |
Marker Measurement
Marker
Marker is a triangle sign (as shown in the following figure), which is used for marking the point on the trace. Through the marker, you can read the amplitude and frequency of the point on the trace, or the sweep time point.
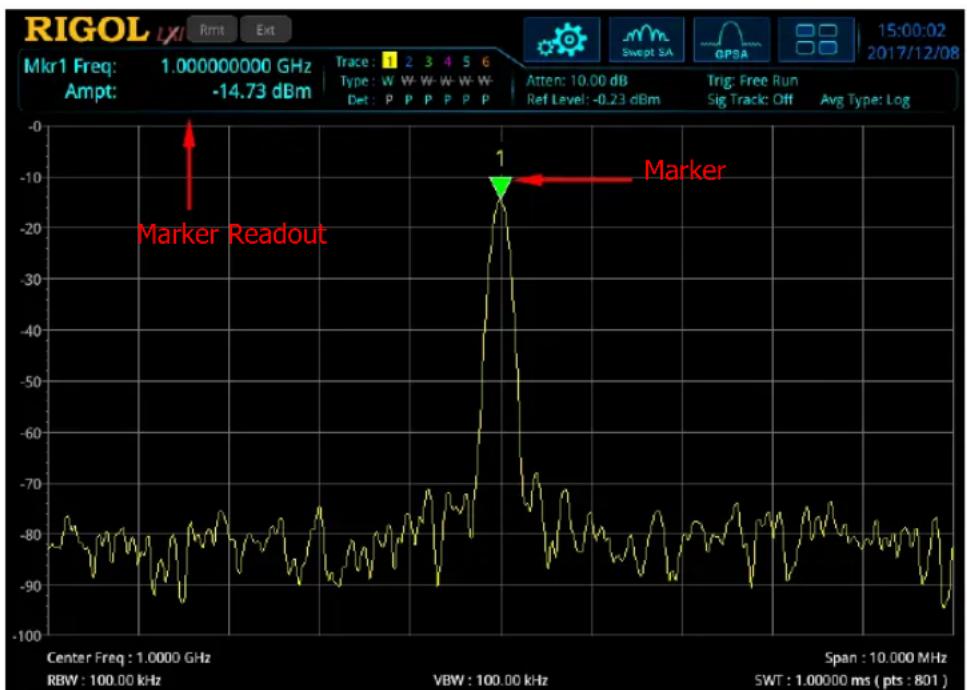
Figure 2-14 Marker
Remarks:
- RSA3000 offers 8 markers. Each time, one marker or one pair of markers can be turned on.
- In the Marker menu, you can use the numeric keys, the knob, or the arrow keys to modify frequency or time; to view the readout of different points on the trace. You can also use the touch screen to do the above things.
Selected Marker
RSA3000 provides 8 markers. By default, Marker1 is selected under "Selected Marker". After you select a marker, you can set parameters such as the marker mode, the marker trace, and marker readout. The currently enabled marker will be marked on the trace selected under Marker Trace. The readout of the currently activated marker at the marker point will be displayed in the measurement result bar at the upper-left corner of the screen.
Marker Mode
Sets the type of the marker. The available marker modes include Position, Delta, Fixed, and Off.
1. Position
It is used to measure the X (Frequency or Time) and Y (Amplitude) values of a certain point on the trace. When "Position" is selected, a marker indicated by a number ("1") appears on the trace.
Remarks:
- If no active marker exists currently, a marker will be enabled at the center frequency of the current trace.
- The readout resolution of the X-axis (frequency or time) is related to the span. To obtain a higher readout resolution, reduce the span.
2. Delta
It is used to measure the difference between "reference point" and "certain point on the trace": X (frequency or time) and Y (amplitude) value. When "Delta" is selected, a pair of markers appears on the trace: Reference Marker (marked by "X") and the Delta Marker (marked by " ").
Remarks:
- If an active marker exists currently, then activate a reference marker at the current marker; otherwise activate both the reference marker and Delta marker at the same time at the center frequency.
- When you change the position of the Delta marker, the position of the reference marker remains unchanged, but the frequency (or time) difference between the two markers will change along with it.
- The frequency (or time) difference between the two markers and the amplitude difference between them are displayed in the measurement result bar at the upper-left corner of the screen.
Application of the "Delta" Marker
It is used to measure the S/N ratio of the single spectrum signal.
Move the reference marker to the location where the signal resides, and move the Delta marker to the location where the noise resides. The amplitude displayed in the measurement results is S/N ratio.
3. Fixed
When you select "Fixed" marker, you can directly or indirectly set the X-axis and Y-axis values for the marker. Once specified, its position remains unchanged, and its Y-axis value does not change along with the trace. The fixed marker is generally used as the reference marker for the Delta marker. It is indicated by the sign "X".
4. Off
Turns off the marker currently selected. Then, the marker information displayed in the screen and the functions concerning the marker will also be disabled.
Reference Marker
Sets the reference marker for the current marker. By default, the reference marker is the marker next to it.
Remarks:
● Each marker can have another marker to be its reference marker.
- If the current marker is a Delta marker, the measurement result of the marker will be determined by the reference marker.
- Any marker cannot take itself to be the reference marker.
Marker Trace
Selects the trace that the current marker marks. It can be Trace1, Trace2, Trace3, Trace4, Trace5, or Trace6. One marker can only mark one trace. The selected trace determines the position of the marker, the readout unit of the marker, and the final readout results.
Marker Trace Auto
Enables or disables the auto marking trace function.
Remarks:
- When you enable the marker's auto marking trace function, the marker shifts from its off state to on state, and the marker's marking trace is automatically
determined by the instrument.
- When you disable the marker's auto marking trace function, whatever states of the marker and the trace, the marker will be associated to the current marker trace.
- If you specify the marker's marking trace manually, the marker's auto marking trace function is automatically disabled.
Marker Freq | Time
Sets the frequency (non-zero span) or time (zero span) of the marker to change the position of the marker on the trace. Press this key to modify the value to change the position of the marker.
Table 2-54 Marker Frequency
| Parameter | Remarks |
| Default | 2.25 GHz |
| Range | 0 to 4.5 GHz |
| Unit | Readout = Frequency (or 1/Δtime), the available unit is GHz, MHz, kHz, or Hz.Readout = Time (or Period), the available unit is s, ms, μs, ns, or ps. |
| Knob Step | Readout = Frequency (or 1/Δtime), step = span/(sweep points - 1)Readout = Time (or Period), step = sweep time/(sweep points - 1) |
| Left/Right Arrow Key Step | |
| Up/Down Arrow Key Step | Readout = Frequency (or 1/Δtime), step = span/10Readout = Time (or Period), step = sweep time/10 |
Marker Amplitude
When the marker type is set to "fixed", you can press this key to set the Y value of the current marker.
Marker Readout
Selects a desired readout type of the X-axis for the marker and each marker can be configured with different readout types. This setting will change the readout type and will not change the actual value. The setting will affect the marker readouts in the measurement result bar at the upper-left corner of the screen.
1. Frequency
If you select "Frequency" to be the readout type, the "Position" and the "Fixed" marker modes display the absolute frequency; whereas the "Delta" marker mode displays the frequency difference between the Delta marker and the reference marker. In non-zero span mode, the default readout is "Frequency".
2. Time
If you select "Time" to be the readout type, the "Position" and the "Fixed" marker modes display the time difference between the marker and the start of the sweep; whereas the "Delta" marker mode displays the sweep time difference between the Delta marker and the reference marker. In zero span mode, the default readout is "Time".
3. I/Time
If you select "I/Time" to be the readout type, it displays the reciprocal of sweep time difference between the Delta marker and the reference marker. When the time difference is zero, the reciprocal is infinite, and "--" is displayed.
4. Period
If you select "Period" to be the readout type, the "Position" and the "Fixed" marker modes display the reciprocal of the marker frequency; whereas the "Delta" marker displays the reciprocal of the frequency difference. When the frequency difference is zero, the reciprocal is infinite, and "--" is displayed.
Readout Auto
Enables or disables the readout auto function.
Remarks:
- When you enable the function, if the trace is the frequency-domain trace, then the readout mode is frequency.
- If the marker is in auto reading state, and the marker trace changes, then the readout mode should be re-determined based on the destination trace.
- If the readout mode of X-axis is manually set, then the X-axis value will not change with the trace.
Line State
Enables or disables the marker line.
Remarks:
- When you enable the marker line, a cross line is displayed at the amplitude point where the marker resides. The width of the horizontal line and the height of the vertical line are consistent with the length and height of the graticule in the
waveform display area.
- If the marker is not visible in the selected area, extend the marker line to the display area for better observation. This function is useful for the marker outside the display area. The marker extension line can better display the amplitude of the marker, making it easy for you to observe and compare.
Couple Markers
Enables or disables the couple marker function.
Remarks:
- When this function is enabled, moving any marker will enable other markers (except the Fixed or Off marker) to move with it.
- The fixed marker does not move along with other marker, but if the fixed marker moves, other non-fixed markers will move with it.
Marker Table
Enables or disables the marker table.
When it is set to "On", the lower section of the split screen displays all the enabled markers in the form of lists. They include marker number, trace number, marker readout type, X-axis readout, and amplitude. Through this table, you can view the measurement values of multiple points.
Note: The marker table currently opened can be saved to the internal or external memory, and you can recall it at any time if you need. Press Save to save it according to descriptions in "Save".

Figure 2-15 Marker Table
Marker All Off
Turns off all the enabled markers and their related functions.
Marker To
Sets the other system parameters (such as center frequency and reference level) by using the current marker values. Press any key under Marker To to activate a marker automatically if no marker is currently enabled.
Mkr->CF
Sets the center frequency of the analyzer to the frequency of the current marker.
- If Position marker is selected, the center frequency will be set to the frequency of the current marker.
- If Delta marker is selected, the center frequency will be set to the frequency of the Delta marker.
● This function is invalid in zero span.
Mkr->CF Step
Sets the center frequency step of the analyzer to the frequency of the current marker.
- If Position marker is selected, the center frequency step will be set to the frequency of the current marker.
- If Delta marker is selected, the center frequency step will be set to the frequency difference between the Delta marker and the reference marker.
● This function is invalid in zero span.
Mkr->Start
Sets the start frequency of the analyzer to the frequency of the current marker.
- If Position marker is selected, the start frequency will be set to the frequency of the current marker.
- If Delta marker is selected, the start frequency will be set to the frequency of the Delta marker.
● This function is invalid in zero span.
Mkr->Stop
Sets the stop frequency of the analyzer to the frequency of the current marker.
- If Position marker is selected, the stop frequency will be set to the frequency of the current marker.
- If Delta marker is selected, the stop frequency will be set to the frequency of the Delta marker.
● This function is invalid in zero span.
Mkr->Ref
Sets the reference level of the analyzer to the amplitude of the current marker.
- If Position marker is selected, the reference level will be set to the amplitude of the current marker.
- Given a Delta marker, if the current marker is the reference marker, then the reference level is set to the amplitude of the reference marker; if the current marker is the Delta marker, then the reference level is set to the amplitude of the Delta marker.
MkrΔ->CF
Sets the center frequency of the analyzer to the frequency difference between the two Delta markers.
- Only when "Delta" marker is selected, can this function be valid.
● This function is invalid in zero span.
MkrΔ->Span
Sets the span of the analyzer to the frequency difference between the two Delta markers.
- Only when "Delta" marker is selected, can this function be valid.
● This function is invalid in zero span.
Marker Function
N dB State
Enables or disables the N dB bandwidth measurement function.
Note: In the N db measurement state, if the current marker is disabled, then the N dB BW measurement function is also disabled.
N dB Bandwidth
Sets the N dB value.
The N dB Bandwidth denotes the frequency difference between two points that are located on both sides of the current marker and with N dB fall (N<0) or rise (N>0) in amplitude, as shown in the figure below.

Figure 2-16 N dB Bandwidth Measurement
Remarks:
- When the measurement starts, the analyzer will search for the two points which are located at both sides of the current point with N dB fall or rise in amplitude. Once the two points are found, the analyzer will display the frequency difference between the two points in the active function area. Once not found, "----" would be displayed.
● You can use the numeric keys, the knob, or arrow keys to modify the value of N.
For details, refer to descriptions in "Parameter Setting".
Table 2-55 N dB BW Parameter Settings
| Parameter | Remarks |
| Default | -3.01 dB |
| Range | -140 dB to -0.01 dB |
| Unit | dB |
| Knob Step | 1 dB |
| Left/Right Arrow Key Step | |
| Up/Down Arrow Key Step | 1 dB |
Band Function
The band function defines the corresponding parameters for a frequency band to measure the signal at the marker point. When the band function is enabled and "Detector Auto" is enabled, then the Detector Type is automatically modified to "Average (RMS)".
1. Noise
When the noise measurement function is enabled, the measurement result of the Y-axis is the average noise level normalized to 1 Hz within the frequency band.
2. Band Power
In non-zero span mode, it calculates the total power within a span. In zero span mode, it calculates the average power within a certain time range.
3. Band Density
In non-zero span mode, the band density is the total power within the bandwidth to be measured divided by the measurement bandwidth. In zero span mode, the band density is the measured band power divided by Bn (Bn refers to the noise bandwidth of the RBW filter.)
4. Off
Disables the band function. Disabling the band function will neither affect the frequency band parameters nor disable the marker.
Band Adjust
Adjusts the bandwidth parameters for the band function.
1. Band Span
Sets the bandwidth of the signal involved in the calculation for the band function.
2. Band Left
Sets the left edge frequency of the signal involved in the calculation for the band function.
3. Band Right
Sets the right edge frequency of the signal involved in the calculation for the band function.
4. Band Span Auto
Sets the manual/auto setting of the band span. When it is set to "Auto", the band span is 5% of the span or 5% of the sweep time. When you select "Manual", you can press Band Span to set it.
Marker Counter
Enables or disables the frequency counter function of the current marker.
Remarks:
- If no active marker currently exists, turning on the frequency counter will open a Position marker automatically.
- The frequency readout will be more accurate when the frequency counter is enabled.
- In zero span mode, enabling the frequency counter can measure the frequency near the center frequency.
- In the Delta marker mode, if the current reference marker is not a fixed type, then the reference marker can also be used for frequency counting.
Gate Time
Sets the length of time for the marker counter to make gate measurement.
Table 2-56 Gate Time
| Parameter | Remarks |
| Default | 100 ms |
| Range | 1 μs to 500 ms |
| Unit | s, ms, μs, ns, ps |
| Knob Step | gate time/100, Min = 1 μs |
| Left/Right Arrow Key Step | |
| Up/Down Arrow Key Step | at 1-1.5-2-3-5-7.5 step |
Gate Time Auto
Turns on or off the auto gate time for marker counter.
Remarks:
- Enables the auto gate time, and the gate time of the marker count is determined by the instrument automatically.
- When the auto gate time is disabled, press Gate Time to set it.
Peak
The peak search function enables the marker to move to the specific signal peak point, and then in combination with the function of Delta marker, it can provide a powerful analysis capability.
Peak Search
Performs the peak search function.
Remarks:
- If "Max" is selected under Search Mode, the system will search for the maximum value on the trace and mark it with a marker.
- If "Para" is selected under Search Mode, the system will search for the peak of the specified parameter on the trace and mark the peak with a marker.
- The peak search for the Next Peak, Next Peak Right, Next Peak Left, or peaks in the peak table must meet the specified peak search condition.
- When no peak meets the specified peak search condition, "No peak found" is displayed.
Next Peak
Searches for and marks the peak whose amplitude on the trace is next to that of the current peak and which meets the peak search condition.
Next Peak Right
Searches for and marks the nearest peak which is located at the right side of the current peak and meets the peak search condition.
Next Peak Left
Searches for and mark the nearest peak which is located at the left side of the current peak and meets the peak search condition.
Minimum Search
Searches for and marks the peak with the minimum amplitude on the trace.
Pk-Pk Search
Executes Peak Search and Minimum Peak functions at the same time, and marks the results with the Delta marker. Wherein, the result of Peak Search is marked with the reference marker and the result of Minimum Peak is marked with the Delta marker.
Cont Peak
Enables or disables continuous peak search. By default, it is Off. When it is enabled, after finishing each sweep, the analyzer will automatically execute one peak search operation to track the measurement signal.
When the marker is a fixed type, the Cont Peak menu is grayed out and disabled. The signal track and continuous peak functions are mutually exclusive. Once either of them is enabled, the menu of the other one will be grayed out. When the Cont Peak function is on, if the current marker is off, set the marker to Position mode, and then execute the peak search operation.
Difference between Cont Peak and Signal Track
In Cont Peak, the system always searches for the maximum in the current frequency channel; while in Signal Track, the system will search for and mark the point (with no more than 3 dB variation in amplitude) near the marker before Signal Track is enabled, and then set the frequency of this point to be the center frequency.
Peak Config
1. Peak Threshold
Specifies the minimum value of the peak amplitude. Only when the peak is greater than the peak threshold, can it be judged as a peak.
Table 2-57 Peak Threshold
| Parameter | Remarks |
| Default | -90 dBm |
| Range | -200 dBm to 0 dBm |
| Unit | dBm, -dBm, V, mV, uV |
| Knob Step | 1 dBm |
| Left/Right Arrow Key Step | |
| Up/Down Arrow Key Step | 5 dBm |
2. Threshold State
Enables or disables the peak threshold function.
3. Peak Excursion
Sets the amplitude of the peak. It defines the minimum amplitude variation required for a signal to be identified as peak.
Table 2-58 Peak Excursion
| Parameter | Remarks |
| Default | 6 dB |
| Range | 0 dB to 100 dB |
| Unit | dB |
| Knob Step | 1 dB |
| Left/Right Arrow Key Step | |
| Up/Down Arrow Key Step | 5 dB |
4. Excursion State
Enables or disables the peak excursion function.
Remarks:
- When the peak excursion function is enabled, press Peak Excursion to set it.
- When the peak excursion function is disabled, the Peak Excursion menu is disabled and grayed out.
5. Threshold Line
Sets whether to display the peak threshold line or not. By default, it is off.
Remarks:
- When the threshold state is on, the threshold line is, by default, on; when the threshold state is off, the threshold line is off. The threshold line displays the amplitude it represents.
- If the excursion state is on, then the peak amplitude line will be displayed at the top of the peak threshold, and the peak area will be displayed at the left section.

6. Search Mode
Sets the peak search condition: maximum value on the trace or the parameter that meets the search criteria.
- The available options are Max and Para. If "Max" is selected, the system searches for the maximum value on the trace. This setting applies only to the peak search executed by pressing Peak. Other searches such as Next Peak, Next Peak Right, and Next Peak Left are all searched based on "Para".
- If "Para" is selected, the system searches for the peak that meets the search criteria on the trace.
Peak Table
Turns on or off the peak table. By default, it is Off.
When the peak table is turned on, the display is split into a measurement window and a peak table display window. The peak table will be displayed at the lower section of the screen, displaying the searched parameters (frequency and amplitude) that meet the criteria. You can use the externally connected mouse to click and drag the slide bar, use the scroll wheel in the middle of the mouse, use the touch screen gestures, press the Up/Down arrow keys and the corresponding keyboard shortcut keys to page up and down the peak table.
The marker table currently opened can be saved to the internal or external memory of the analyzer, and you can recall it at any time if you need. Press Save to save it according to descriptions in "Save".

Figure 2-17 Peak Table
Peak Table Sort
Selects the peak table sorting rule. Two options are available: Freq and Ampl. That is, list the peak in the order of ascending frequency or descending amplitude.
Pk Table Readout
Sets the peak display condition to All, >Display Line, or <Display Line.
All
Lists all the peaks defined by the peak criteria, reading out based on the current sort setting in the peak table.
- >Display Line
Displays the peaks meeting the peak criteria and whose amplitudes are greater than the specified display line in the table.
- <Display Line
Displays the peaks meeting the peak criteria and whose amplitudes are smaller than the specified display line in the table.
Note: If the display line is off, the peak table displays all the peaks that meet the criteria. If you select ">Display Line" or "<Display Line" under "Table Readout", you should turn on the display line first.
Display Line
Sets the display line level to change its display location. This line can be used as either the reference for you to read the measurement result or the threshold condition for the peaks displayed in the peak table. For details, refer to descriptions in "Display Line" under System → Display.
Chapter 3 Functions of the Front Panel of RTSA
RTSA contains the digital IF component that has a strong processing capability. In real-time mode, all signal samples are processed to produce measurement results or initiate a trigger. In most cases, like the frequency swept analysis, the real-time analysis produces scalar results, such as power or amplitude.
RTSA has the following features:
— Seamless capture and analysis;
— High-speed measurement;
— Stable and consistent measurement speed;
— Frequency mask trigger;
— Diversified and advanced composite display
In general, the high-speed data stream in real-time mode can be used in the following two ways: to be served as the data source of composite spectrum display or be compared with the frequency mask to produce the frequency mask trigger.
This chapter describes in detail the function keys on the front panel and their associated menu functions in RTSA.
Note: The keys or menus that have the same functions as those in GPSA will not be described in this chapter. For details, refer to the relevant contents in Chapter 2.
Contents in this chapter:
■ Basic Settings
■ Sweep and Function Settings
■ Measurement Settings
Marker Setup
Basic Settings
FREQ
Press FREQ on the front panel to enter the frequency setting menu. In this menu, Center Frequency is, by default, selected. You can modify the frequency-related parameters in this menu.
For details about each item under this menu, refer to "FREQ" in Chapter 2.
Note: "Signal Track" menu is not available in RTSA mode.
SPAN
Press SPAN to enter the span setting menu. In this menu, Span is, by default, selected.
Span (Acq BW)
Sets the frequency range of the current channel.
Remarks:
- When you modify the span, the start and stop frequency will be modified automatically, with the center frequency remains to be unchanged.
- In manual span mode, the minimum span can be set to 5 kHz. When set to the full span, the span of analyzer is set to the currently supported maximum real-time bandwidth.
- You can use the numeric keys, the knob, and the arrow keys on the front panel to modify this parameter; also you can modify it on the touchscreen. For details, refer to descriptions in "Parameter Setting".
Table 3-1 Span
| Parameter | Remarks |
| Default[1] | 10 MHz |
| Range[2] | 5 kHz to 10 MHz |
| Unit | GHz, MHz, kHz, Hz |
| Knob Step | span/200, Min = 2 Hz |
| Left/Right Arrow Key Step | |
| Up/Down Arrow Key Step | at 1-2-5 step |
Note [1] : If the option RSA3000-B25 is installed, the default value is 25 MHz. If the option RSA3000-B40 is installed, the default value is 40 MHz.
Note [2] : If the option RSA3000-B25 is installed, its range is from 5 kHz to 25 MHz. If the option RSA3000-B40 is installed, its range is from 5 kHz to 40 MHz.
Last Span
Sets the span to the previous span setting.
Full Span
Sets the maximum span.
Remarks:
- In RTSA mode, the maximum bandwidth for single data acquisition is the maximum IF bandwidth of the installed option.
- For the standard configuration, the full span is 10 MHz.
- For the Option RSA3000-B25, the maximum bandwidth for single data acquisition is 25 MHz, so its full span is 25 MHz.
- For the Option RSA3000-B40, the maximum bandwidth for single data acquisition is 40 MHz, so its full span is 40 MHz.
Ref Value (PvT)
Sets the reference time for the horizontal axis in the PvT view. Modifying this value will not cause you to restart measurements. It is only used for trace display. When you enable the auto scale function or modifying the reference position, the ref value will be modified accordingly. Note that this menu is only valid in PvT measurement mode.
Table 3-2 Ref Value (PvT)
| Parameter | Remarks |
| Default | 0 μs |
| Range | -1 s to 40 s |
| Unit | s, ms, μs, ns, ps |
| Knob Step | ref value/100, min = 1 μs |
| Left/Right Arrow Key Step | |
| Up/Down Arrow Key Step | at 1-1.5-2-3-5-7.5 step |
Note: The PvT measurement displays the power variation of the signal within the user-defined time. The horizontal axis represents time, and the vertical axis represents amplitude.
Scale/Div (PvT)
Sets the unit per division in the horizontal axis of the PvT view. Modifying this value will not cause you to restart measurements. It is only used for trace display. When you enable the auto scale function, the ref value will be modified accordingly. Note that this menu is only valid in PvT measurement mode.
Table 3-3 Scale/Div (PvT)
| Parameter | Remarks |
| Default | acquisition time/10 |
| Range | 20 μs ~ 4 s |
| Unit | s, ms, μs, ns, ps |
| Knob Step | X-axis scale/100, min = 1 μs |
| Left/Right Arrow Key Step | |
| Up/Down Arrow Key Step | at 1-1.5-2-3-5-7.5 step |
Ref Position (PvT)
Sets the position of the reference time in the horizontal axis of the PvT view to "Left", "Center", or "Right". Note that this menu is only valid in PvT measurement mode.
Auto Scale (PvT)
Selects the setting mode for the horizontal scale of the PvT view. Note that this menu is only valid in PvT measurement mode.
Remarks:
- When you select "Auto", the auto scale function enables you to automatically set the reference time and the X-axis scale based on the acquisition time and reference position.
— The X-axis scale is 10% of the acquisition time.
— The reference time is set to a different value according to a different reference position. When the reference position is set to "Left", the reference time is 0 μs; when set to "Center", the reference time is half of the acquisition time; when set to "Right", the reference time equals to the acquisition time.
- When you set the reference time and the X-axis scale manually, the auto scale function will automatically switch to "Manual".
AMPT
Press AMPT on the front panel to enter the amplitude setting menu. In this menu, Reference Level is, by default, selected.
In non-PvT measurement mode and the PvT measurement mode (except the Ref Level and Scale/Div menus), for details about each item under this menu, refer to "AMPT" in Chapter 2.
Ref Level (PvT)
In the PvT measurement view, adjusting the reference level only changes the position of the trace displayed on the screen, but will not cause you to restart measurement. Note that this menu is only valid in PvT measurement mode.
Table 3-4 Ref Level (PvT)
| Parameter | Remarks |
| Default | 0 dBm |
| Range | -250 dBm to 250 dBm |
| Unit | dBm, -dBm, V, mV, μV |
| Knob Step | For "Log" scale type, step = reference level/10 |
| Left/Right Arrow Key Step | For "Lin" scale type, step = 0.1 dBm |
| Up/Down Arrow Key Step | For "Log" scale type, step = reference levelFor "Lin" scale type, step = 1 dBm |
Scale/Div (PvT)
Sets the unit per division in the vertical axis of the PvT view. Note that this menu is only valid in PvT measurement mode.
Table 3-5 Scale/Div (PvT)
| Parameter | Remarks |
| Default | 10 dB |
| Range | 0.1 dB to 20 dB |
| Unit | dB |
| Knob Step | scale ≥0.1, step = 1 dB |
| Left/Right Arrow Key Step | scale < 0.1, step = 0.1 dB |
| Up/Down Arrow Key Step | at 1-2-5 step |
Sweep and Function Settings
BW
Press BW to enter the bandwidth setting menu. In this menu, you can select the filter type and RBW.
RBW
In RTSA mode, RBW selects from a pre-calculated selection of RBW values, which are computed based on the following formula: RBW = SPAN/Ratio. Wherein, Ratio is the Span/RBW ratio determined by the selected filter type.
In RTSA mode, there are 6 filter types available for you to choose. They correspond to 6 RBW values, namely RBW1 through RBW6. You can select a proper RBW value according to your needs.
Note: When the filter type is set to "Rectangular", RBW is automatically set to "RBW1", and "RBW2 through RBW6" are invalid.
| Filter Type | Ratio1 1,024 point | Ratio2 521 point | Ratio3 256 point | Ratio4 128 point | Ratio5 64 point | Ratio6 32 point |
| Gaussian | 404.761 | 205.938 | 101.190 | 50.595 | 25.298 | 12.649 |
| Flattop | 212.187 | 107.958 | 53.047 | 26.523 | 13.262 | 6.631 |
| Blackman-Harris | 399.131 | 203.074 | 99.783 | 49.891 | 24.946 | 12.473 |
| Rectangular | 800.782 | 407.429 | 200.196 | 100.098 | 50.049 | 25.024 |
| Hanning | 534.376 | 271.885 | 133.594 | 66.797 | 33.399 | 16.699 |
| Kaiser | 398.176 | 201.588 | 99.544 | 49.772 | 24.886 | 12.443 |
RBW Auto
Sets the coupling mode of RBW to be "Auto" or "Manual".
Remarks:
- When you select "Auto", RBW is in auto coupling state.
- When you select "Manual" or directly set the RBW value, the coupling mode can be changed.
Filter Type
Sets the type of the FFT window function.
RTSA adopts 6 filter types: Gaussian, Flattop, Blackman-Harris, Rectangular, Hanning, and Kaiser.
You can select a proper filter type according to the actual measurement requirements. You can refer to the following table.
| Window Function | Spectral Leakage | Amplitude Accuracy | Frequency Resolution |
| Gaussian | Moderate | Good | Moderate |
| Flattop | Good | Excellent | Poor |
| Blackman-Harris | Excellent | Good | Moderate |
| Rectangular | Poor | Poor | Excellent |
| Hanning | Good | Moderate | Good |
| Kaiser | Good | Good | Moderate |
Note: After you select the PvT measurement view in the PvT measurement mode, the bandwidth setting menu BW is disabled.
Sweep
Press Sweep to enter the sweep setting menu. In this menu, set the sweep and control function of the analyzer.
Acq Time
Sets the acquisition time for producing one single trace or one persistence bitmap. In this mode, the generated single trace will combine multiple overlapped FFT analysis results.
Table 3-6 Acquisition Time
| Parameter | Remarks |
| Default | 1 ms |
| Range[1] | 100 μs to 40 s |
| Unit | s, ms, μs, ns, ps |
| Knob Step | acquisition time/100, Min = 1 μs |
| Left/Right Arrow Key Step | |
| Up/Down Arrow Key Step | at 1-1.5-2-3-5-7.5 step |
Note[1]: If a Density view exists, the minimum acquisition time can be set to 32 ms ; if no Density view exists, the minimum acquisition time can be set to 100 µs .
Acq Time Auto
Sets the state of the acquisition time for the spectrum analysis to "Auto" or "Manual".
Remarks:
- When "Auto" is selected, the acquisition time adopts the default value.
- When "Manual" is selected, the acquisition time can be set manually within its available range.
Acq Time (PvT)
In PvT mode, the acquisition time applies to all the traces, including the spectrum traces and spectrogram traces. Note that this menu is the same as the above Acq Time menu, the difference is that they can be set separately in different measurement modes.
Table 3-7 Acquisition Time
| Parameter | Remarks |
| Default | 30.00 ms |
| Range | 0 s to 40 s |
| Unit | s, ms, μs, ns, ps |
| Knob Step | acquisition time/100, Min = 1 μs |
| Left/Right Arrow Key Step | |
| Up/Down Arrow Key Step | at 1-1.5-2-3-5-7.5 step |
Acq Time Auto (PvT)
Sets the acquisition time for the PvT analysis to "Auto" or "Manual".
Remarks:
- When "Auto" is selected, the acquisition time (PvT) adopts the default value.
- When "Manual" is selected, the acquisition time (PvT) can be set manually within its available range.
Continue
In RTSA mode, the continuous sweep function is logically same as that in GPSA mode. Press this key to perform the continuous sweep or measurement operation. This setting is global to all the activated traces and the detector types.
For details, refer to "Continue" in Chapter 2.
Single
In RTSA mode, the single sweep function is logically same as that in GPSA mode. Press this key to perform the single sweep or measurement operation. This setting is global to all the activated traces.
Note: In RTSA mode, when performing the single measurement, the instrument will not stop sweeping until the sweep count has reached N. Wherein, N is determined by the result of "Avg. Number x (Acq/Trigger)" in the current measurement mode. During the single measurement, the trace data in the Normal view is updated for display in a real-time manner, whereas the trace history data in the Spectrogram view are not cleared.
For details, refer to "Single" in Chapter 2.
Trigger
Press Trigger on the front panel to enter the trigger setting menu. The settings for the trigger parameters are basically the same as that in GPSA. In RTSA, IF power trigger and FMT are added. The Video trigger is not supported.
The following section will introduce IF power trigger and FMT. For descriptions about the parameter settings for "Slope", "Trigger Delay Switch", "Trig Delay", "Trigger Holdoff Switch", "Trigger Holdoff", "Auto Trig Switch", and "Auto Trig", please refer to "Trigger" in Chapter 2.
Acq/Trigger
Sets the number of times for acquisition after each trigger signal that meets the requirements generated a trigger.
Table 3-8 Acq/Trigger
| Parameter | Remarks |
| Default | 1 |
| Range | 1 to 8,192 |
| Knob Step | 1 |
| Left/Right Arrow Key Step | |
| Up/Down Arrow Key Step | at 1-1.5-2-3-5-7.5 step |
Power Trigger
A trigger signal will be generated when the system detects that the IF signal power exceeds the set IF power.
Power
Sets the trigger level of the IF power trigger. When the signal meets the set trigger edge and exceeds the trigger level value, a trigger occurs. The IF power level is displayed in the waveform display area in the form of horizontal lines. When the set value is not within the waveform display range, the trigger level line is displayed at the top or bottom of the waveform display area.
Table 3-9 Power
| Parameter | Remarks |
| Default | 0 dBm |
| Range | (-140+level offset) to (30+level offset) |
| Knob Step | 1 dBm |
| Left/Right Arrow Key Step | |
| Up/Down Arrow Key Step | at 1-3-10 step |
FMT
1. Mask Type
Determines which mask (upper or lower) is being displayed on the screen.
● Upper: only displays the upper mask.
● Lower: only displays the lower mask.
● Both: displays both the upper and lower masks.
2. Mask Edit
Press this key to enter the FMT editing interface. You can use the front panel keys to set the FMT. Besides, you can also finger touch or use the keypad to set and edit the FMT parameters in the FMT editing interface. In the visual prompt interface (only available in the single-window measurement mode), you can set and edit the FMT parameters. In the visual prompt interface, you can quickly set the common parameters. The detailed setting methods are the same as what you do with the corresponding front panel keys.
In addition, in the visual prompt interface, settings for the color style of the FMT are added. You can select the desired style from the available color template.

Figure 3-1 FMT Editing Interface
1) Active Mask
Selects the mask type that needs to be activated currently. The following operations for editing and setting the mask points are only valid for the currently activated mask type.
2) Navigation
Selects the first line of the mask editing table.
3) Frequency
Sets the frequency of the mask point. Its range is within the frequency range supported by the analyzer.
4) Amplitude
Sets the amplitude of the mask point. Its range is within the amplitude range supported by the analyzer.
5) Insert Point
Adds a mask point.
6) Delete Point
Deletes the currently selected mask point.
7) Delete Mask
Deletes the currently activated mask point.
8) Build From Trace
Selects a trace to build a mask.
9) Build
Builds a mask from the selected trace. The mask points are generated based on the rough outline of the trace. You can use the X and Y offset to adjust the mask position.
10) Export
Exports the mask to the file. You can also press Save → FMT to save the mask to the file.
11) Import
Press this key, and then the file manager interface is displayed. You can import the mask from the file. You can also press Recall → FMT to import the mask from the file.
12) Recall
In the file manager interface, after you select the desired file, press this key to load the corresponding mask.
13) To Mask
Selects the FMT file and imports it to the selected mask.
14) New Mask
Clears the currently activated mask and creates a default new mask.
15) X Offset
Sets the offsets of all the frequency points of the currently activated mask.
16) Y Offset
Sets the offsets of all the amplitude points of the currently activated mask.
17) Apply Offset
Adds the X and Y offsets to each point of the current mask.
18) X Axis Type
When "Fixed" is selected, the frequency of the current mask point will not be affected by the center frequency. When "Relative" is selected, the frequency of the current mask point is the difference between the frequency of the current mask point and the current center frequency. If you change the parameter state after completing the mask setup, the frequency of the mask should change with the state to keep the mask points to be in the same position relative to the current center frequency of the instrument.
19) Y Axis Type
When "Fixed" is selected, the amplitude of the current editing point will not be affected by the reference level. When "Relative" is selected, the amplitude of the current mask point is the difference between the amplitude of the current mask point and the current reference level. If you change the parameter state after completing the mask setup, the amplitude of the mask should change with the state to keep the mask points to be in the same position relative to the current reference level of the instrument.
3. Trigger Mask
Sets the currently effective trigger mask.
● Upper: only sets the upper trigger mask to be effective.
● Lower: only sets the lower trigger mask to be effective.
● Both: sets both the upper and lower trigger masks to be effective.
Note: When "Upper" is selected under Mask Type, the trigger mask is, by default, the upper mask; when "Lower" is selected under Mask Type, the trigger mask is, by default, the lower mask; when "Both" is selected under Mask Type, the trigger mask is, by default, the one before switching the mask type.
4. Trigger Criteria
Sets the condition that will cause the FMT trigger to occur. Both upper and lower masks use the same trigger criteria, and the trigger will occur when either mask meets the trigger criteria.
- Enter: Two states are required to initiate a trigger event. The signal must be outside the mask and then passes into the mask. The trigger event occurs when the first non-violating waveform is detected.
- Leave: Two states are required to initiate a trigger event. The signal must be inside the mask and then passes out of the mask. The trigger event occurs when the first non-violating waveform is detected.
- Inside: Only one state is required to initiate a trigger event. The signal has at least one data point inside (above) the mask. The trigger event occurs when the instrument detects the first signal with a point violating the mask. A trigger event could occur on the first acquisition.
- Outside: Only one state change is required to initiate a trigger event. The signal has all data points outside (below) the mask. The trigger event occurs when the instrument has detected the first spectral waveform that is completely below (outside) the mask. A trigger event could occur on the first acquisition.
- Enter-Leave: Three states are required to initiate a trigger event. The signal starts outside the mask and then passes into the mask. Next, the signal must pass outside the mask. The trigger event occurs at the second transition where the signal passes back out of the mask.
- Leave-Enter: Three states are required to initiate a trigger event. The signal starts inside the mask and then passes out of the mask. Next, the signal must pass into the mask. The trigger event occurs at the second transition
where the signal passes back into the mask.
Trace
Press Trace on the front panel to enter the trace setting menu. In this menu, you can perform the operations related to trace, such as trace acquisition, trace display, trace saving, trace detector, and trace data.
Remarks:
- Normal view: all the traces are available. The trace type can be set to any of the available trace types.
- Density view: only Trace1 is available. The trace type can be set to any of the available trace types. During the toggle of various measurement modes, before you enter the Density view, all other enabled and updated traces are turned off automatically; when you return to the previous mode, the traces will be restored to their previous state. The trace math operation function is disabled.
- Spectrogram view: all the traces are available.
— Trace1: The trace type can only be set to "Clear Write", and the rest trace types are disabled and grayed out.
— Trace2 through Trace6: The trace type can be set to "Clear Write", "Max Hold", and "Min Hold". The trace type "Average" is disabled;
— The trace math operation function is disabled.
● Density Spectrogram view:
— Only Trace1 is available;
— The trace type can only be set to "Clear Write", and the rest trace types are disabled and grayed out;
— The trace math operation function is disabled.
- When making PvT-related measurements, select the PvT view: only Trace1 is available; the trace type can only be set to "Clear Write"; the trace math operation function is disabled.
Trace Detector
Sets the type of the trace detector, and it is valid for all the traces. The trace detector is, by default, determined automatically by the instrument. If you set the type of the trace detector manually, the detector auto setting function will be disabled. The available trace detectors include Pos Peak, Neg Peak, Sample, and Average.
For details about the trace menu items in the real-time spectrum measurement mode, refer to "Trace" in Chapter 2. In this manual, all the Trace menu items in the PvT measurement mode are expressed with "PvT" attached in brackets to distinguish themselves from the same menu items under other measurement modes.
Trace Detector (PvT)
Sets the trace detector for the PvT mode.
Detector Auto (PvT)
Enables or disables the Detector Auto function in PvT mode. By default, Detector Auto is enabled. If you set the detector type manually, please disable the Detector Auto function.
Trace Update (PvT)
Enables or disables the trace update in PvT mode.
Trace Display (PvT)
Enables or disables the trace display in PvT mode.
Preset All (PvT)
In PvT mode, turns on Trace 1, and blanks all other traces. This operation does not affect the trace type, trace detector, and other states.
Clear All (PvT)
Clears all traces in PvT mode. All the trace data will be set to the minimum trace value (except the case that the trace is in Min Hold state). When the trace is in Min Hold state, the trace data will be set to the maximum trace value. That is, even if you turn off the trace update, the trace data will be updated after you perform the "Clear All" operation.
Note: The trace settings in PvT and non-PvT modes are independent of each other. In PvT view, 6 traces are all available for setting, but only one trace can be displayed.
Measurement Settings
Meas
In RTSA mode, Normal, Density, Spectrogram, Density Spectrogram, PvT, PvT Spectrum, PvT Spectrogram, and AMK are available.
After you select a measurement function, the screen is split into several display windows; in multi-window mode, you can touch the screen or use the mouse to select a specified window as the current window, and maximize the current window. If you select a different window, its corresponding menu will be different.
Normal
Measurement Interface:

Figure 3-1 Normal View
After you select Normal to be the measurement type, the measurement interface is shown in the figure above. Press Meas Setup to set the relevant parameters.
Remarks:
- In RTSA mode, all signal samples are processed to produce measurement results based on the set mode or initiate a trigger.
- In Normal view, Limit measurement function is supported.
Density
Measurement Interface:

Figure 3-2 Density View
The instrument defaults to Density measurement mode, and the measurement interface is shown in the figure above. After you select Density to be the measurement type, press Meas Setup to set the relevant parameters.
Remarks:
● The density is defined as the number of times a frequency and amplitude point is hit during an acquisition interval.
- The Density view will also display a white trace. This trace shows the real-time spectrum for the latest acquisition interval. When using positive peak, negative peak, or average detectors, the white trace obtains detector data from all the data within the acquisition time; when using the Sample detector, the last FFT was used.
- To display the signal status within a longer time range, you can display multiple Density views on the screen. The latest Density view is displayed with the highest brightness. The longer the time from the latest Density view, the lower brightness of the Density view. Such display of the brightness is generally called persistence view.
- The Density view is displayed combined with the persistence view. X-axis represents frequency, Y-axis represents amplitude, Z-axis represents number of hits, and T-axis represents time. This view displays four dimensional data on a two-dimensional display, using color to represent Z-axis and brightness to represent T-axis.
Spectrogram
Measurement Interface:

Figure 3-3 Spectrogram View
After you select Spectrogram to be the measurement type, the measurement interface is shown in the figure above. Press Meas Setup to set the relevant parameters.
Remarks:
- The Spectrogram view is displayed in multiple windows, including displaying the conventional Normal view. In this view, the multiple windows have a coupling relationship. The conventional Normal view displays the specified spectral line set by the trace parameters. Select the Normal view, Limit measurement function is supported. In the Spectrogram view, a white horizontal line represents the currently displayed trace. In the Spectrogram mode, display trace 1 indicates the latest trace.
- In the view, each horizontal line represents a trace, and the vertical Y-axis represents time. The latest trace data is displayed at the top of the Spectrogram by default, and the historical traces are moved up one position. The Spectrogram can hold 8,192 traces. When Spectrogram occupies a Window that has full vertical size, 486 traces can be displayed at one time. When Spectrogram occupies the vertical window in the lower section, 230 traces can be displayed at one time.
-
In the view, the colors represent signal amplitude. The color bar is displayed at the far left of the Spectrogram view. For details about the settings of the color bar, refer to "Ref Hue".
-
When you select a trace that has not yet been acquired, both the trace window and Spectrogram window will remain blank until the trace is acquired. Then, once a trace is acquired in the Spectrogram window, the window will be updated for one time. The trace window will show the specified trace.
- Any parameter change will clear out the spectrogram and restart an acquisition, unless in the idle state (single measurement or waiting for a trigger). The data will also be cleared on exit from the Spectrogram view.
- In the Spectrogram view, zero time is the point where the first trace starts an acquisition, meaning that each subsequent trace point is at a positive time that represents when that point was gathered, relative to the start point. Each trace is time stamped as it starts, and this time is remembered for each trace. With the increase of the traces, the time difference for the successive traces get larger.
Density Spectrogram
Measurement Interface:
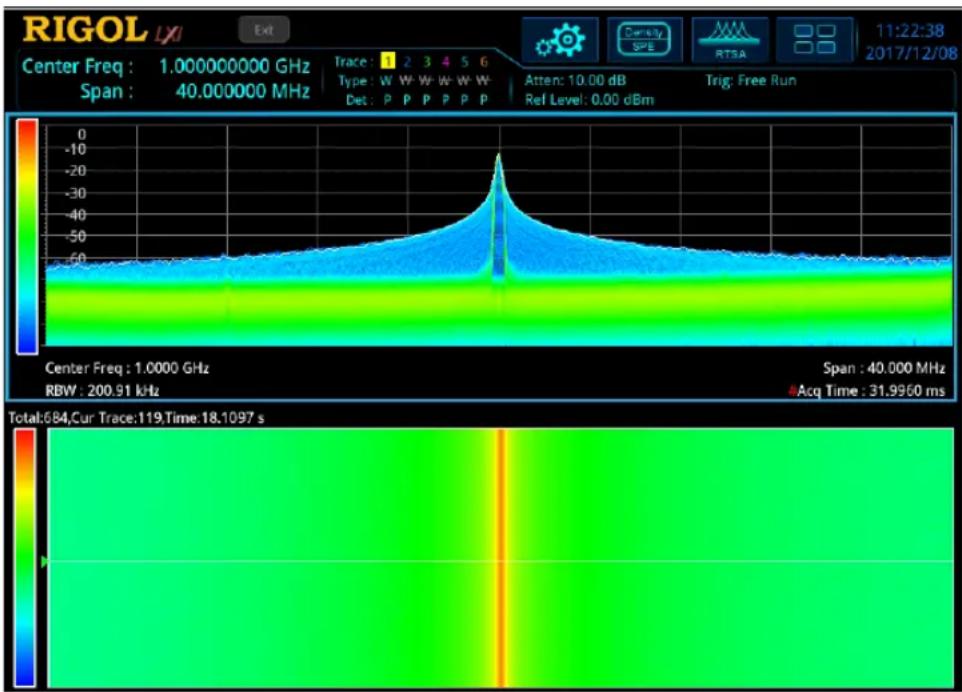
Figure 3-4 Density Spectrogram View
After you select Density Spectrogram to be the measurement type, the measurement interface is shown in the figure above. Press Meas Setup to set the relevant parameters.
Remarks:
- The Density Spectrogram view is displayed in multiple windows, including Density and Spectrogram views. In this view, multiple windows have a coupling
relationship. You can use the mouse or touch the screen to display one of the windows in full screen.
- The parameter rule in the Density view is consistent with that in the single Density view. Note that the white real-time trace in the Density view corresponds to the display trace in the Spectrogram view, but the trace in the Density view shows the latest data.
- The parameter rule in the Spectrogram view is consistent with that displayed in the single Spectrogram view.
- The combined Density and Spectrogram view display the traces, the occurrences of all the signals within the acquisition interval time, their corresponding frequency/amplitude and time information.
PvT
Measurement Interface:

Figure 3-5 PvT View
After you select PVT to be the measurement type, the measurement interface is shown in the figure above. Press Meas Setup to set the relevant parameters.
Remarks:
- The PvT measurement provides an analysis for time-domain data. X-axis represents the acquisition time, and Y-axis represents the power value of the signal.
- In RTSA mode, the acquisition time in PvT measurement can be different from that in the real-time spectrum measurement, but in the combined display of PvT
Spectrogram and PvT Spectrum, the acquisition time of the real-time spectrum measurement will be set to the PvT acquisition time.
- The menu items under BW in PvT measurement are disabled. The menu items of SPAN, AMPT, Trace, Sweep, Marker, Marker->, and Marker Func can be set separately.
PvT Spectrum
Measurement Interface:

Figure 3-6 PvT Spectrum View
After you select Pvt Spectrum to be the measurement type, the measurement interface is shown in the figure above. Press Meas Setup to set the relevant parameters.
Remarks:
- The PvT Spectrum view is displayed in multiple windows, including PvT view and real-time normal view. In PvT Spectrum view, multiple windows have a coupling relationship. You can use the mouse or touch the screen to display one of the windows in full screen.
- The parameter rule in the PvT Spectrum view is consistent with that in the single PvT view.
- The parameter rule in the real-time normal view is consistent with that in the single Normal view. Select the Normal view, Limit measurement function is supported.
- In PvT mode, the acquisition time applies to all the traces.
PvT Spectrogram
Measurement Interface:

Figure 3-7 PvT Spectrogram View
After you select Pvt Spectrogram to be the measurement type, the measurement interface is shown in the figure above. Press Meas Setup to set the relevant parameters.
Remarks:
- The PvT Spectrogram view is displayed in multiple windows, including PvT view, real-time normal view, and spectrogram view. In PvT Spectrogram view, multiple windows have a coupling relationship. You can use the mouse or touch the screen to display one of the windows in full screen.
- The parameter rule in the PvT Spectrum view is consistent with that in the single PvT view.
- The parameter rule in the real-time normal view is consistent with that in the single Normal view. Select the Normal view, Limit measurement function is supported.
- The parameter rule in the spectrogram view is consistent with that in the single Spectrogram view.
- In PvT mode, the acquisition time applies to all the traces.
Advanced Measurement Function (AMK)
Measurement Interface:

Figure 3-8 SSC Measurement Interface
(1) Meas Off
Disables the advanced measurement function and returns to the Normal view in RTSA mode.
(2) SSC
SSC advance measurement function is a measurement analysis function specially customized for 2FSK signal. When you enter the SSC function interface, the screen is automatically split into two sections for display, with the upper section as the measurement window displaying the measurement trace; the lower section as the measurement result window displaying the measurement results. The measurement interface is shown in the figure above. Press Meas Setup to set the corresponding parameters.
Meas Setup
Open the parameter setting menu of the function selected in the Meas menu. In the Meas Setup menu, only the menu items related to the current measurement function are displayed. Please view the relevant menus according to the current measurement function.
Avg Number
Specifies the number of times for averaging the measurement results. The average value is displayed in a real-time manner after each measurement is completed.
Table 3-10 Average Count
| Parameter | Remarks |
| Default | 10 |
| Range | 1 to 1,000 |
| Unit | None |
| Knob Step | 1 |
| Left/Right Arrow Key Step | |
| Up/Down Arrow Key Step | 1 |
Limit
Sets the parameters of limit lines. For details, refer to "Limit" in Chapter 2. Only when you select "Normal" view, can the limit line operation be available.
Meas Preset
Restores all parameters of the current measurement mode to their preset values, without clearing the limit line.
Density Parameters
1. Persistence
Sets how long the frequency/amplitude points displayed in the bitmap should take to fade.
Remarks:
- The persistence controls the length of time it will take for a point to go from 100% intensity to 0% intensity.
- If the point in the bitmap does not appear again during the persistence time, then the point will gradually become transparent until it disappears.
2. Persistence Infinite
Enables or disables the infinite mode of the persistence display.
- When off, it indicates the finite mode. At this time, you can define the persistence time. You can observe the density of each point over the entire measurement time.
- When on, it indicates the infinite mode. Infinite mode shows the total number of times a frequency/amplitude point appear during all the capture intervals since starting the measurement. In the infinite mode, the intensity for all the frequency/amplitude points is 100%, and there will be no fading, but its density will change with the measurement time.
3. Color Palettes
Selects different color palettes which allows optimization of visibility and contrast for different signal environment. In RTSA mode, there are five color palettes available for you to choose: Cool, Warm, Radar, Fire, and Frost. By default, "Warm" is selected to be the color palette.
4. Highest Density Hue
Sets the maximum density expressed in percentage.
Table 3-11 Highest Density Hue
| Parameter | Remarks |
| Default | 100 |
| Range | 0.1 to 100 |
| Unit | None |
| Knob Step | 0.1 |
| Left/Right Arrow Key Step | |
| Up/Down Arrow Key Step | at 1-1.5-2-3-5-7.5 step |
5. Lowest Density Hue
Sets the minimum density expressed in percentage.
Table 3-12 Lowest Density Hue
| Parameter | Remarks |
| Default | 0 |
| Range | 0 to 99.9 |
| Unit | None |
| Knob Step | 0.1 |
| Left/Right Arrow Key Step | |
| Up/Down Arrow Key Step | at 1-1.5-2-3-5-7.5 step |
6. Curve Nonlinearity
Within the range between the highest density hue and lowest density hue, setting the curve nonlinearity can change the gradient among different density hues, making the displayed results move towards either the higher or lower end of the gradient. Increasing the curve nonlinearity value will compress the colors towards the higher end of the color bar, and decreasing the nonlinearity value will compress the colors towards the lower end of the color bar.
Table 3-13 Curve Nonlinearity
| Parameter | Remarks |
| Default | 75 |
| Range | -100 to 100 |
| Unit | None |
| Knob Step | 1 |
| Left/Right Arrow Key Step | |
| Up/Down Arrow Key Step | at 1-1.5-2-3-5-7.5 step |
7. Auto Adjust Color
Sets the highest density due to the highest density value found in the current bitmap; sets the lowest density hue to the lowest non-zero density value found in the current bitmap.
8. Hue Truncate
Enables or disables the hue truncate function. When on, the area that is greater than the maximum value and smaller than the minimum value will be indicated in black; when off, it is indicated by boundary value.
Spectrogram Parameters
1. Display Trace
Sets the trace index displayed in the trace window in the Spectrogram mode. You can determine the trace either by the trace number or the trace time. Trace 1 indicates the latest trace. If you select the trace by trace time, select a trace that is closest to the set time.
Table 3-14 Display Trace
| Parameter | Remarks |
| Default | 1 |
| Range | 1 to 8,192 |
| Unit | None |
| Knob Step | 1 |
| Left/Right Arrow Key Step | |
| Up/Down Arrow Key Step | at 1-1.5-2-3-5-7.5 step |
2. Trace Selection
Sets the type for the trace to be displayed in the trace window. It can be set to "Time" or "TNum".
Each trace is associated with a time value that represents the acquisition time. The formula is as follows: Trace Time = Trace Number x Acquisition Time.
3. Couple Marker Trace
Sets whether to couple the marker to the selected trace. Turn on a marker, and set Marker Z to n. The available range of n is from 1 to 8,192. Set the Display Trace number to n. At this time, enable the Trace Couple function. Then, the marker will stay with the selected Trace n, and changes with it. When you disable the Trace Couple function, the marker will be fixed to Marker n that is set when you turn on the marker. Modify the Display Trace number, and the marker will not change with the trace.
4. Ref Hue
Adjusts the hue at the top of the color bar in the Spectrogram. The color bar in the Spectrogram is placed next to the waveform display to map the amplitude and color in the Spectrogram.
Table 3-15 Ref Hue
| Parameter | Remarks |
| Default | 0 |
| Range | 0 to 359.9 |
| Unit | None |
| Knob Step | 0.01 |
| Left/Right Arrow Key Step | |
| Up/Down Arrow Key Step | at 1-1.5-2-3-5-7.5 step |
The hues of the colors run from 0 to 359 are shown below:

In the hue ring, Hue 0 is red (255,0,0), Hue 120 is green (0,255,0), Hue 240 is blue (0,0,255), Hue 60 is yellow (255,255,0), Hue 180 is Cyan (0,255,255), and Hue 300 is magenta (255,0,255). In Region A-B, the red value is constant (255); in Region C-D, the green value is constant (255); in Region E-F, the blue value is constant (255). There is no green in Region F-A, no blue in Region B-C, and no red in Region D-E.
When adjusting the reference hue, you are adjusting the hue at the top of the color bar. The bottom of the color bar shows the hue that is 240 degrees clockwise from the reference hue.
5. Ref Hue Pos
Sets the position of the reference hue displayed in the graticule. Any amplitudes higher than the reference position are displayed as black.
Table 3-16 Reference Hue Position
| Parameter | Remarks |
| Default | 100 |
| Range | Max (10%, bottom hue value + 10%) to 100.0 |
| Unit | None |
| Knob Step | 1 |
| Left/Right Arrow Key Step | |
| Up/Down Arrow Key Step | at 1-1.5-2-3-5-7.5 step |
6. Bottom Hue Pos
Sets the bottom hue position displayed in the graticule. Any amplitudes lower than the bottom hue position are displayed as black.
Table 3-17 Bottom Hue Position
| Parameter | Remarks |
| Default | 0 |
| Range | 0 to Min (90%, reference position value - 10%) |
| Unit | None |
| Knob Step | 1 |
| Left/Right Arrow Key Step | |
| Up/Down Arrow Key Step |
7. Auto Adjust Hue
Auto adjusts the reference hue position and bottom hue position based on the highest amplitude value found in the spectrogram and the lowest amplitude value found in the spectrogram, respectively. The reference hue position is set to be the highest amplitude value, and the bottom hue position to be the lowest amplitude value.
SSC
The SSC function can continuously capture the signals with abrupt changes of power.
1) Max Hold
Enables or disables the Max Hold. When the Max Hold is enabled, the signal captured each time will be compared with the last captured signal, whichever is the larger value will be displayed as the max hold trace.
2) Reset
Clears the existing measurement results.
3) Mark Line1 State
Enables or disables Mark Line1. When Mark Line1 is enabled, a blue vertical line is displayed in the basic measurement window.
4) Mark Line1
Displays or sets the frequency value at Mark Line1. You can use the numeric keys, the knob, or arrow keys to modify the frequency value at Mark Line1; you can also use the touch screen to modify the value.
5) Mark Line2 State
Enables or disables Mark Line2. When Mark Line2 is enabled, a red vertical line is displayed in the basic measurement window.
6) Mark Line2
Displays or sets the frequency value at Mark Line2. You can use the numeric keys, the knob, or arrow keys to modify the frequency value at Mark Line2; you
can also use the touch screen to modify the value.
7) Pass/Fail
Enables or disables the Pass/Fail function. Before enabling the Pass/Fail function, refer to the descriptions in the following section to edit the limit.
- On: If the amplitudes of 6 peaks are all within the amplitude range, it indicates "Pass". At this time, "Pass" is displayed in the measurement result display window. Otherwise, it indicates "Fail". At this time, "Fail" is displayed in the measurement result display window.
- Off: A message indicates that test stops is displayed in the measurement result display window.
8) Limit Edit
Sets the amplitude limit range of all peaks in the Pass/Fail test.
- Signal: Selects a signal to edit its amplitude limit range. The peaks that correspond to the selected signals are shown in the following table.
| Signal | Peak |
| 1 | Peak1 and Peak2 |
| 2 | Peak3 and Peak4 |
| 3 | Peak5 and Peak6 |
- Ampt Up: Sets the upper limit of the amplitude.
- Ampt Down: Sets the lower limit of the amplitude.
Marker Setup
Marker
In RTSA mode, the Marker function in the real-time spectrum view is basically the same as that for GPSA (Note that when you select the Density view or the Spectrum view, the Marker Z menu is enabled). In the PvT measurement view, you are only allowed to set the marker on Trace1, and the "Marker Trace", "Marker Trace Auto", "Marker Readout", and "Readout Auto" menus are not supported. Other menus are basically the same as that in the real-time spectrum view.
Marker Z
Sets the trace number of the spectrum trace where the marker stays in the Density or Spectrogram view. Only when you select the Spectrogram view, can this menu be effective.
For details about the marker, refer to relevant contents of "Marker" in Chapter 2.
Marker To
In RTSA mode, the Marker To function in the real-time spectrum view is basically the same as that for GPSA. In the PvT measurement view, only the "Mkr -> Ref" menu is supported.
For details about the marker, refer to relevant contents of "Marker To" in Chapter 2.
Marker Function
In RTSA mode, only "N dB Bandwidth" and "Band Function" menus are supported in the real-time spectrum view; whereas in the PvT measurement view, only "Band Function" is supported.
For details about the "N dB Bandwidth" and "Band Function" menus, refer to relevant contents of "Marker Function" in Chapter 2.
Peak
In RTSA mode, the peak function is basically the same as that for GPSA. For details, refer to relevant contents of "Peak" in Chapter 2.
Chapter 4 Input/Output
Sets the input/output interface.
Input Impedance
Sets the input impedance for voltage-to-power conversions (refer to equation (2-4)). The default input impedance is 50 Ω. To measure a 75 Ω device, you should use a 75 Ω to 50 Ω adapter (option) supplied by RIGOL to connect the analyzer with the system under test, and then set the input impedance to 75 Ω.
Ext Gain
Compensates for gain or loss in the measurement system outside the instrument.
Remarks:
- The value does not affect the trace position, but will modify the parameters such as reference level readout and the marker amplitude readout.
- You can use the numeric keys, the knob, and the arrow keys on the front panel to modify this parameter; also you can modify it on the touchscreen. For details, refer to descriptions in "Parameter Setting".
Table 4-1 External Gain
| Parameter | Remarks |
| Default | 0 dB |
| Range | -120 dB to 120 dB |
| Unit | dB |
| Knob Step | 1 dB |
| Left/Right Arrow Key Step | |
| Up/Down Arrow Key Step | 5 dB |
Ext Trigger2
Sets the external trigger 2 [TRIGGER IN/OUT] to be the "input" or "output" interface.
Demod
Sets the demodulation type to AM or FM; or disable the demodulation function. The default is Off.
Remarks:
● After AM (or FM) demodulation is enabled, the system will enable a marker automatically. Place it at the center frequency and perform AM (or FM) demodulation at this frequency point.
- RSA3000 provides an earphone jack, and the demodulated signal can be output in audio frequency (AF) mode through the earphone. The frequency and intensity of AF denotes the frequency and amplitude of the signal respectively.
Demod Setup
1. Earphone
Sets the status of the earphone. When it is on, the demodulated signal can be heard through the earphone during the demodulation. By default, it is Off.
2. Volume
Sets the volume of the earphone.
Table 4-2 Volume
| Parameter | Remarks |
| Default | 100 |
| Range | 0 to 255 |
| Unit | N/A |
| Knob Step | 10 |
| Arrow Key Step | 10 |
3. Demod Time
Sets the time for the analyzer to complete a signal demodulation after each sweep. If Earphone is set to "On", you will hear the sound of the demodulated signal through the earphone during the demodulation. You can use the numeric keys, the knob or the arrow keys to modify this parameter. For details, please refer to descriptions in "Parameter Setting".
Table 4-3 Demod Time
| Parameter | Remarks |
| Default | 100 ms |
| Range | 5 ms to 1 ks |
| Unit | ks, s, ms, μs, ns, ps |
| Knob Step | 1 ms |
| Arrow Key Step | 1 ms |
4. Signal Gain State
Sets the signal gain state to "Manual" or "auto".
5. Signal Gain
Sets the signal gain to adjust the signal energy. When the signal amplitude is small, the better demodulation effect can be obtained by adjusting the gain value. You can use the numeric keys, the knob or the arrow keys to modify this parameter. You can also use the touch screen to modify the parameter. For details, please refer to "Parameter Setting".
Table 4-4 Signal Gain
| Parameter | Remarks |
| Default | 7 |
| Range | 1 to 7 |
| Unit | N/A |
| Knob Step | 1 |
| Arrow Key Step | 1 |
Chapter 5 Shortcut Key
Auto Tune
Automatically searches for the signal within the full frequency range, and adjusts the frequency and amplitude for optimal display effect of the signal to realize one-key signal search and auto setting of parameters.
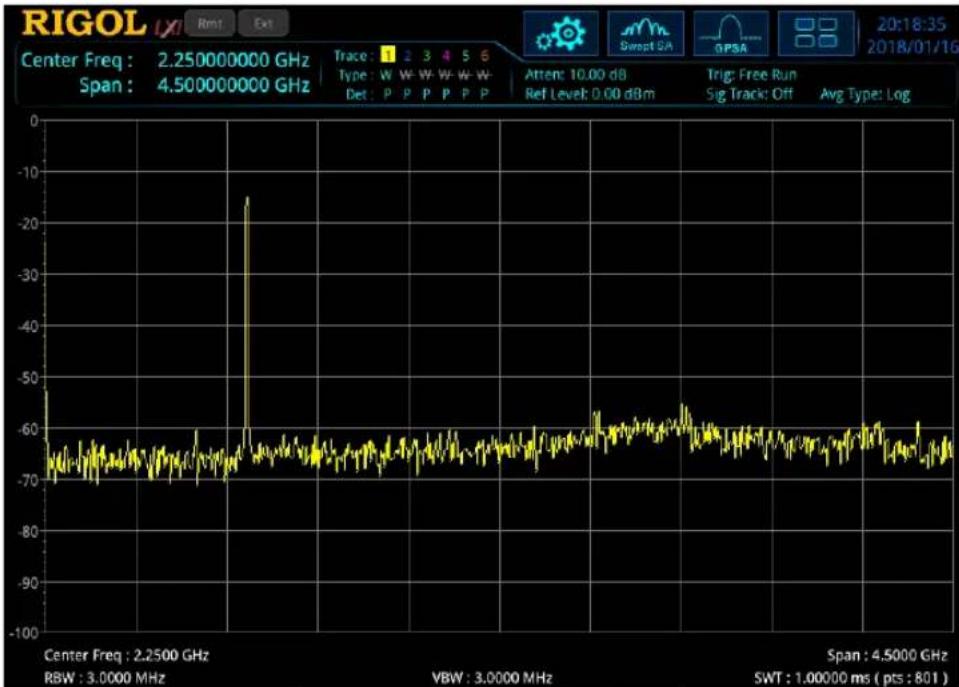
Figure 5-1 Before Auto Search

Figure 5-2 After Auto Search
Remarks:
- In the process of auto search, the backlight of the Auto Tune key on the front panel turns on. After the search is finished, the backlight of the key turns off.
- Some parameters such as the reference level, scale, input attenuation, and maximum mixer level may be changed during the auto search.
- Enable the AMK function or the calibration signal in GPSA mode; or the Auto Tune function is disabled in RTSA mode.
Preset
Recalls the preset setting and restores the system settings of the analyzer to a specified status.
Remarks:
- To set the preset type, press System → Preset → Preset Type to select "Default" or any one of the items from "User1" to "User6".
- Press Preset to recall the specified factory settings (as shown in the following table, except the items specified in Note[3]) or user settings.
| Parameter Name | GPSA Parameter Value | RTSA Parameter Value | |
| Non-PvT | PvT | ||
| FREQ | |||
| Center Freq | 2.25 GHz | 2.25 GHz | |
| Start Freq | 0 Hz | 2.245 GHz | |
| Stop Freq | 4.5 GHz | 2.255 GHz | |
| CF Step | Auto, 450 MHz | Auto, 1 MHz | |
| Freq Offset | 0 Hz | 0 Hz | |
| Signal Track | Off | -- | |
| SPAN | |||
| Span | 4.5 GHz | 10 MHz | |
| Ref Value | -- | -- | 0 us |
| Scale/Div | -- | -- | 3.1946 ms |
| Ref Position | -- | -- | Left |
| Auto Scale | -- | -- | Auto |
| AMPT | |||
| Ref Level | 0 dBm | 0 dBm | |
| Attenuation | Auto, 10 dB | Auto, 10 dB | |
| RF Preamp | Off | Off | |
| Y Axis Unit | dBm | dBm | |
| Scale Type | Log | Log | |
| Scale/Div | 10 dB | 10 dB | |
| Max Mixer Lvl | -10 dBm | -10 dBm | |
| Ref Offset | 0 dB | 0 dB | |
| BW | |||
| RBW | Auto, 10 MHz | Auto, 50.228 kHz (RBW2) | -- |
| SPAN/RBW Ratio | Auto, 106 | -- | -- |
| VBW | Auto, 10 MHz | -- | -- |
| VBW/RBW Ratio | Auto, 1 | -- | -- |
| Filter Type | Gaussian | Kaiser | -- |
| Sweep | |||
| Sweep Points | 801 | -- | |
| Sweep Time | Auto, 1 ms | -- | |
| Acq Time | -- | Auto, 31.9460 ms | Auto, 31.9460 ms |
| Sweep Time Mode | Continuous | Continuous | |
| Sweep Time Rule | Normal | -- | |
| Trigger | |||
| Trigger Source | Free Run | Free Run | |
| Trigger Holdoff | Off, 100 ms | Off, 100 ms | |
| Auto Trig | Off, 100 ms | Off, 100 ms | |
| Slope | Positive | Positive | |
| Trig Delay | Off, 1 us | Off, 1 us | |
| Trigger Level | -25 dBm | -- | |
| Acq/Trigger | -- | 1 | |
| Power | -- | 0 dB | |
| Mask Type | -- | Upper | |
| Trigger Mask | -- | Upper | |
| Trigger Criteria | -- | Enter | |
| Active Mask | -- | Upper | |
| Frequency | -- | 0 Hz | |
| Amplitude | -- | -100 dBm | |
| Build From Trace | -- | Trace1 | |
| X Offset | -- | 0 Hz | |
| Y Offset | -- | 0 dB | |
| X Axis Type | -- | Fixed | |
| Y Axis Type | -- | Fixed | |
| Trace | |||
| Selected Trace | Trace1 | Trace1 | -- |
| Trace Type | Clear Write | Clear Write | -- |
| Trace Det | Normal | Pos Peak | Pos Peak |
| Detector Auto | On | On | On |
| Trace Update | On | On | On |
| Trace Display | On | On | On |
| Math Function | Off | Off | -- |
| Op1 | Trace5 | Trace5 | -- |
| Op2 | Trace6 | Trace6 | -- |
| Offset | 0 dB | 0 dB | -- |
| Reference | 0 dBm | 0 dBm | -- |
| TG[1] | |||
| Output | Off | -- | |
| Amplitude | -40 dBm | -- | |
| Amplitude Offset | 0 dB | -- | |
| Normalize | Off | -- | |
| Reference Level | 0 dB | -- | |
| Reference Position | 100% | -- | |
| Reference Trace | Off | -- | |
| Mode | |||
| Measurement Mode | GPSA | ||
| Mode Setup | |||
| Global CF Mode | Off, 0 Hz | Off, 0 Hz | |
| Meas[2] | |||
| Measurement Function | Swept SA Measurement | Normal | |
| Measure Setup[2] (GPSA) | |||
| Swept SA Measurement | |||
| Avg Number | 100 | ||
| Avg Mode | Log | ||
| Avg State | On | ||
| Test Limits | Off | ||
| Select Limit | Limit1 | ||
| Limit State | Off | ||
| Test Trace | Trace1 | ||
| Limit Type | Upper | ||
| X to CF | Relative | ||
| Y to Ref | Relative | ||
| Margin | Off, 0 dB | ||
| Frequency | 0 Hz | ||
| Amplitude | 0 dBm | ||
| Build From Trace | Trace1 | ||
| X Offset | 0 Hz | ||
| Y Offset | 0 dB | ||
| Select Limit | Limit1 | ||
| Limit Type | Upper | ||
| X To CF | Fixed | ||
| Y To Ref | Fixed | ||
| Margin | Off, 0 dB | ||
| Test Trace | Trace1 | ||
| Test Limits | On | ||
| Limit State | Off | ||
| T-Power | |||
| Avg Number | 10 | ||
| Avg Mode | Exponential | ||
| Avg State | On | ||
| TP Type | Peak | ||
| Start Line | 0 us | ||
| Stop Line | 1 ms | ||
| ACP | |||
| Avg Number | 10 | ||
| Avg Mode | Exponential | ||
| Avg State | On | ||
| Main Chan BW | 2 MHz | ||
| Adj Chan BW | 2 MHz | ||
| Chan Spacing | 2 MHz | ||
| Multichan Pwr | |||
| Avg Number | 10 | ||
| Avg Mode | Exponential | ||
| Avg State | On | ||
| Channel Span | 4.5 GHz | ||
| Channel Sheet | Off | ||
| Channel Freq | 2.25 GHz | ||
| Occupied BW | |||
| Avg Number | 10 | ||
| Avg Mode | Exponential | ||
| Avg State | On | ||
| Max Hold | Off | ||
| OBW Span | 2 MHz | ||
| Power Ratio | 99% | ||
| Emission BW | |||
| Avg Number | 10 | ||
| Avg Mode | Exponential | ||
| Avg State | On | ||
| Max Hold | Off | ||
| EBW Span | 2 MHz | ||
| EBW X dB | -10 dB | ||
| C/N Ratio | |||
| Avg Number | 10 | ||
| Avg Mode | Exponential | ||
| Avg State | On | ||
| Offset Freq | 2 MHz | ||
| Noise BW | 2 MHz | ||
| Carrier BW | 2 MHz | ||
| Harmo Dist | |||
| Avg Number | 10 | ||
| Avg Mode | Exponential | ||
| Avg State | On | ||
| No. of Harmo | 10 | ||
| Harmonic ST | 1 ms | ||
| TOI | |||
| Avg Number | 10 | ||
| Avg Mode | Exponential | ||
| Avg State | On | ||
| TOI Span | 2 MHz | ||
| Measure Setup[2](RTSA) | |||
| Normal | |||
| Avg Number | 100 | ||
| Test Limits | Off | ||
| Select Limit | Limit1 | ||
| Limit State | Off | ||
| Test Trace | Trace1 | ||
| Limit Type | Upper | ||
| X to CF | Relative | ||
| Y to Ref | Relative | ||
| Margin | Off, 0 dB | ||
| Frequency | 0 Hz | ||
| Amplitude | 0 dBm | ||
| Build From Trace | Trace1 | ||
| X Offset | 0 Hz | ||
| Y Offset | 0 dB | ||
| Density | |||
| Avg Number | 100 | ||
| Persistence | 300 ms | ||
| Pers Inf | Off | ||
| Color Palettes | Warm | ||
| Highest Density Hue | 100 | ||
| Lowest Density Hue | 0 | ||
| Curve Nonlinearity | 75 | ||
| Hue Truncate | Off | ||
| Spectrogram | |||
| Avg Number | 100 | ||
| Display Trace | 1 | ||
| Trace Selection | Trace Number | ||
| Couple Marker Trace | Off | ||
| Ref Hue | 0 | ||
| Ref Hue Pos | 100 | ||
| Bottom Hue Pos | 0 | ||
| SSC | |||
| Max Hold | Off | ||
| Mark Line1 | Off, 2.245 GHz | ||
| Mark Line2 | Off, 2.255 GHz | ||
| Pass/Fail | Off | ||
| Signal | 1 | ||
| Ampt Up | -100 dBm | ||
| Ampt Down | -100 dBm | ||
| Marker | |||
| Selected Marker | Marker1 | Marker1 | Marker1 |
| Marker Mode | Position | Position | Position |
| Reference Marker | Marker2 | Marker2 | Marker2 |
| Marker Trace | Auto, Trace1 | Auto, Trace1 | -- |
| Marker Freq | 2.25 GHz | 2.25 GHz | 15.9730 ms |
| Marker Readout | Frequency | Frequency | -- |
| Readout Auto | On | On | -- |
| Line State | Off | Off | Off |
| Couple Markers | Off | Off | Off |
| Marker Table | Off | Off | Off |
| Peak | |||
| Cont Peak | Off | Off | |
| Pk-Pk Search | Maximum Value | Maximum Value | |
| Peak Threshold | On, -90 dBm | On, -90 dBm | |
| Peak Excursion | On, 6 dB | On, 6 dB | |
| Threshold Line | Off | Off | |
| Peak Table | Off | Off | |
| Peak Table Sort | Amplitude | Frequency | |
| Table Readout | All | All | |
| Marker Func | |||
| N dB Bandwidth | Off, -3.01 dB | Off, -3.01 dB | -- |
| Band Function | Off | Off | Off |
| Marker Counter | Off | -- | -- |
| Gate Time | On, 100 ms | -- | -- |
| System[3] | |||
| Power On | Preset | Preset | |
| Preset Type | Default | Default | |
| Align Auto | Off | Off | |
| LAN Setting Mode | Manual | Manual | |
| Display Line | Off, -25 dBm | Off, -25 dBm | |
| Graticule | On | On | |
| HDMI | Off | Off | |
| HDMI Resolution | 1280*720 60Hz | 1280*720 60Hz | |
| LCD | On | On | |
| LCD Backlight | 100% | 100% | |
| Power Switch | Default | Default | |
| Beep Switch | Off | Off | |
| User key | Off | Off | |
| Language | English | English | |
Note [1] : This function is only available for RSA3045-TG/RSA3030-TG working in GPSA mode.
Note [2] : This function is only available for RSA3000 installed with the corresponding option.
Note [3] : Not affected by Preset settings.
User
User-defined shortcut key. For some hard-to-find but commonly used function menu, you can define it as shortcut key (for the defining method, refer to the introduction in "User Key"). After that, press the shortcut key under any operation interface to quickly open and set the desired menu or function.
Note: You can use the User key to define all the keys on the front panel and the sub-menus of these keys (except Save).
Quick Save
Repeats the most recent save that was performed from the Save menu. Its saving path is the currently defined "quick save path". The register storage does not support Quick Save.
Cont
Press this key to perform the continuous sweep operation. For details, refer to "Continue" in Chapter 2.
Single
Press this key to perform the single sweep operation. For details, refer to "Single" in Chapter 2.
Chapter 6 System Function
System
Sets the system parameters.
Preset
Functions include: select the instrument settings to be recalled after the analyzer is powered on ("Last" or "Preset"); set the preset type ("Factory" or one of the items from "User1" to "User6"); save preset.
1. Power On
Sets the power on setting to "Last" or "Preset".
- When "Last" is selected, the last system settings before power-off would be recalled automatically at power-on.
- When "Preset" is selected, settings defined in Preset Type would be recalled automatically at power-on.
2. Preset Type
Sets the preset type to "Default" (by default) or any one of the items from "User1" to "User6".
- When Power On is set to "Preset", the specified preset type will be recalled at power-on.
- After the instrument starts, press Preset on the front panel in any operation interface will recall the specified preset type.
3. Save User Preset
Saves the current system setting as user-defined settings to the internal non-volatile memory. You can store up to 6 system states (correspond to "User1" to "User6" in the preset type) and name each state file.
When one of the items from "User1" to "User6" is selected under Preset Type, press Save User Preset, and the then automatically enter the filename input interface. Then, perform the saving operation.
Alignment
1. Align Now
Press this key and the analyzer will use the internal calibration source to perform a self-calibration immediately.
2. Align Auto
Enables or disables self-calibration. If self-calibration is enabled, the analyzer performs the self-calibration automatically according to the change of the temperature.
Interface
The analyzer supports the LAN or USB communication interface.
1. LAN
Sets the LAN parameters. Tap the setting information icon at the top of the user interface or use the externally connected mouse to click the icon, and then click the network setting icon when, the LAN parameter setting interface, as shown below, is displayed.

Figure 6-1 LAN Parameter Setting
The following items can be set by the front panel keys, the keyboard shortcut keys, the externally connected mouse, the touchscreen, or remote operation.
1) Mode
Sets the mode of obtaining the IP address.
● DHCP: When DHCP is selected, the DHCP server assigns network
parameters (such as the IP address, subnet mask, and gateway) to the analyzer based on the current network configuration.
- Auto: When "Auto" is selected, the instrument will acquire the IP address ranging from "169.254.0.1" to "169.254.255.254" and the subnet mask (255.255.0.0) automatically based on the current network configuration.
- Manual: When "Manual" is selected, you can self-define a desired IP address for the analyzer.
Note: The analyzer attempts to acquire the IP address configuration according to the sequence of DHCP, Auto IP, and Manual IP. These three methods cannot be disabled at the same time.
2) IP
Press IP and use the numeric keys to input the desired IP address.
The format of the IP address is "nnn.nnn.nnn.nnn". The range for the first segment (nnn) of the address is from 1 to 223 (except 127); and the range for the other three segments is from 0 to 255. You are recommended to ask your network administrator for an IP address available.
3) Subnet mask
Press Mask and use the numeric keys to input the desired subnet mask. The format of the subnet mask is nnn.nnn.nnn.nnn; wherein, the range of "nnn" is from 0 to 255. You are recommended to ask your network administrator for a subnet mask available.
4) Gateway
Press Gateway and use the numeric keys to input the desired gate address.
The format of the default gateway is "nnn.nnn.nnn.nnn". The range for the first segment (nnn) of the address is from 1 to 223 (except 127); and the range for the other three segments is from 0 to 255. You are recommended to ask your network administrator for a gate address available.
5) DNS
- mDNS: enables or disables the sending of the network information (including IP address, host name, etc.).
- DNS Mode: Sets the mode of obtaining the DNS address to be "Manual" or "Auto".
- Preferred DNS: Sets the preferred address for the DNS.
● Backup DNS: Sets the backup address for the DNS.
The format of the DNS address is "nnn.nnn.nnn.nnn". The range for the first segment (nnn) of the address is from 1 to 223 (except 127); and the range for the other three segments is from 0 to 255. You are recommended to ask your network administrator for an address available.
6) Apply
After the LAN interface configuration is finished, press this key to apply the current configuration to the instrument.
7) Reset
Turns on DHCP and Auto-IP; turns Manual-IP off. Clears the set network password and restores it to the factory defaults.
2. USB
RSA3000 provides a USB DEVICE interface on the rear panel. The analyzer may serve as a "slave" device to be connected to the PC via this interface.
Display
Controls the screen display. You can set the current mode, the current measurement interface or window, and other display-related parameters.
1. Display Line State
Turns on or off the display line.
2. Display Line
Sets the display line level to change its display location. This line can be used as either the reference for you to read the measurement result or the threshold condition for the peaks displayed in the peak table.
Remarks:
- This line is a horizontal reference of which the amplitude is equal to the set value, and the corresponding amplitude unit is the same as the Y-axis unit.
- You can use the numeric keys, the knob, and the arrow keys on the front panel to modify the display line level; also you can modify it on the touchscreen. For details, refer to descriptions in "Parameter Setting".
- If there are multiple windows in the user interface, the settings of the display line take effective in the selected window.
- If the display line is out of the visible range, it will be displayed at the top or bottom of the graticule, and indicated by arrows.
Table 6-1 Display Line Level
| Parameter | Remarks |
| Default | -25 dBm |
| Range | Current amplitude range |
| Unit | dBm, -dBm, V, mV, uV |
| Knob Step | In Log scale mode, step = scale/10 |
| Left/Right Arrow Key Step | In Lin scale mode, step = 0.1 dB |
| Up/Down Arrow Key Step | In Log scale mode, step = scaleIn Lin scale mode, step = 1 dB |
3. Graticule
Enables or disables the display of the graticule.
4. HDMI
Enables or disables HDMI.
5. HDMI Resolution
Selects the resolution supported by HDMI interface to be "1280*720 60Hz", "640*480 60Hz", or "720*480 60Hz".
6. LCD
Enables or disables LCD.
Remarks:
- If you are not updating data, turning off LCD can improve the measurement speed.
- To reduce the electromagnetic radiation of some circuit component, turn off the LCD.
● To avoid misoperation, turn off the LCD.
7. LCD Backlight
Sets the brightness of the LCD backlight.
The brightness is expressed in percentage. When it is 100, it indicates that the backlight is the brightest; when it is 1, the backlight is the darkest.
About System
Displays the system information or the option information.
1. System Info
- Model
- Serial Number
● Hardware Version Number
● Firmware Version Number
- Software Version
2. Option Info
Displays the option information.
RSA3000 provides many kinds of options to meet various measurement requirements. To purchase the corresponding option, please contact RIGOL.
3. Self Test
- Screen
Tests whether the screen has a dot defect by using six colors: blue, red, green, gray, white, and black. Press any key to switch the screen color and exit the test.
- Multi-point Touch
Enters the multi-point touch test interface. Use two fingers to make pinch or stretch gestures on the screen, and observe the size of the characters. If they do not change along with your gestures, it indicates that problems occurred to the multi-point touch function. To exit the test, press Esc for three consecutive times.
- Single-point Touch
Enters the single-point touch test interface. Touch or use the mouse to make stretch or strike gestures on the screen, if the corresponding traces are displayed, then it indicates that the point on the touchscreen is valid. To exit the test, press Esc for three consecutive times.
- Keyboard
Enter the keyboard test interface. Press the function keys on the front panel one by one and observe whether the corresponding key is illuminated. If not, an error may have occurred to that key. To exit the test, press Esc for three consecutive times.
Note: For the transparent keys on the front panel, they will be also illuminated during the test.
4. License Info
Displays the license registration information about the components such as Linux and QT.
5. Online Update
Connect the analyzer to the external network by using the network cable. If you do not have the right to access the Internet, please ask the administrators to grant your right to access the external internet first. Then, press this key to update the software.
Date/Time
Sets the system date and time.
1. Set Time
Sets the displayed system time of the analyzer. Press the Hour, Minute, and Second softkeys respectively to set the time.
2. Set Date
Sets the displayed system date of the analyzer. Press the Year, Month, and Day softkeys respectively to set the date. You can also press Date Format to select whether the date is displayed in "YMD" or "MDY" form.
Security Clear
Press this key to perform the security clear function. This function includes the following operations:
- Deletes all the files that users have saved, including the state files, trace state files, screen files, measdata files, and limit files saved by users in all modes.
- Executes the factory resetting operation.
Language
RSA3000 supports multi-language menu, Chinese and English built-in help and pop-up messages.
Press this key to select the desired display language.
Settings
1. Power Switch
Sets whether the power switch on the front panel is effective or not.
- Default: When the analyzer is powered on, press the power switch on the front panel to start up the analyzer.
● Always: When the analyzer is powered on, it starts automatically.
2. Beep Switch
Turns on or off the beeper.
3. Volume
After you turn on the beeper, you can press this key to adjust the volume of the beeper.
4. User Key
Defines an associated function for the User key on the front panel. The definition method is as described below. After that, pressing User in any operation interface can quickly enable the defined function.
- Press User Key to select "On";
- Open the function menu that needs to be defined. For example, press System → Display → Display Line;
Press User and the definition is finished. At this time, User Key turns off automatically.
5. SCPI Display
When you use the SCPI commands to control the instrument remotely, turning on the SCPI Display will go to the specified menu of the corresponding command; turning off the SCPI Display will not go to the specified menu.
Messages
Press this key, and then a prompt message dialog box will be displayed. You can press the corresponding softkey to select to view all the messages, the messages that have been read or not read. You can also use the touch screen or the externally connected mouse to tap or click the specified icon in the prompt message dialog box.
1. Select All
Selects all the displayed messages.
2. Select Read
Only selects the messages that have been read.
3. Select Unread
Only selects the messages that have not been read.
4. Delete
Deletes the selected messages.
5. Query All
Views all the displayed messages.
6. Query Read
Only views the messages that have been read.
7. Query Unread
Only views the messages that have not been read.
File
RSA3000 allows you to save various types of files to the internal or external memory, and recall them when necessary.
Press File on the front panel to enter the file operation menu interface.
File Explorer
Press the key to enter the file manager interface. You can use the touch gestures to tap the screen or use the mouse to click on the screen to select the corresponding file or folder. Displays all the files with the specified file types. When you select a file, you can press the Copy, Paste, or Delete softkeys to copy, paste, or delete the specified file.

Figure 6-2 File Manager
The available file types include: State, Trace+State, Measurement Data, Limit, Screen Image, License, FMT, and All (all the above file types). The descriptions for various file types are shown in the following table.
Table 6-2 Descriptions of File Type
| File Type | Format | Suffix Name |
| State | BIN | .sta |
| Trace+State | BIN | .trs |
| Measurement Data | CSV | .csv |
| Limit | CSV | .csv |
| Screen Image | IMAGE | .jpg/bmp/png |
| License | LICENSE | .lic |
| FMT | CSV | .csv |
Note: RSA3000 can only recognize files whose filenames consist of Chinese characters, English letters, or numbers. If the filename or folder name contains other characters, the file or the folder might not be displayed normally in the file manager interface.
Copy
Copies the currently selected file or folder.
Paste
Pastes the file or folder.
When the current path has contained a file or folder whose name is the same as the one that you want to paste, after you perform the paste operation, the original file or folder will be overwritten.
Rename
Rename a file that has been stored. After you select a file, press this key to input a new filename.
Delete
Deletes the selected file.
New Folder
Creates a folder. Press this key to create a new empty folder under the current directory, and the file is named with a default filename. To modify this filename, press Rename to rename the file.
Quick Print
If the printer has been successfully installed, press this key to quickly print the currently displayed screen image.
Prints the current screen according to print parameter settings when the printer has been successfully installed and is in idle state.
Printer Setup
1. Printer Parameters
1) Page Size
Sets the page size for printing. When "Default" is selected, the page size depends on the printer currently connected.
2) Quality
Sets the print quality.
3) Color
Sets the print color to Color, Mono, Inverse, or Inverse-Mono.
4) Orientation
Sets the print orientation to "Landscape" or "Portrait".
5) Adjust
Sets the print border to be Adaptive, Non-Adpt, and Hold Min.
6) Counts
Sets the print copies and the default is 1. The range available is from 1 to 99.
7) Border
Turns on or off the border.
In addition, you can preview the print page, and set to print the image or the text in All page, 1/2, 1/4, or 1/9 page.
2. Add Device
Queries and adds a printer. Inputs the IP address of the printer, the manufacturer of the printer, the printer model, and printer drive. Then, the printer is added.
3. Select Device
Selects the desired printer.
Import License
In the file manager interface, select a file to be imported and then press Import License to import the file.
System Update
Press this key to update the analyzer software after selecting the update file in the USB storage device.
Recall
RSA3000 allows you to recall various types of files saved to the internal or external storage memory.
Press Recall on the front panel to enter the file recalling menu. The available file types include: State, Trace+State, Measurement Data, Limit, and FMT (only available for RTSA).
State
Press State to enter the state recalling menu. The state can be recalled from the register or the file.
1. Recall
Press File Explorer to enter the file manager interface. Select a file and then press Recall to recall the file from a register or a file.
2. Register1 through Register16
When any one of the items from Register1 to Register16 is selected, the state of the specified register will be recalled.
Trace+State
Press Trace+State to enter the trace+state recalling menu. The state of the instrument and the selected trace can be recalled from a register or a file.
1. Recall
Press File Explorer to enter the file manager interface. Select a file and then press Recall to import the file.
2. To Trace
Selects the trace+state file or the trace data of the register to recall them to the selected trace.
3. Register1 through Register16
When any one of the items from Register1 to Register16 is selected, the state of the specified register will be recalled.
Measurement Data
Press Measurement Data to enter the measurement data recalling menu.
1. Recall
Press File Explorer to enter the file manager interface. Select a file and then press Recall to recall the file.
2. To Trace
Selects the measurement data file and recalls it to the selected trace.
Limit
Press Limit to enter the limit recalling menu.
1. Recall
Press File Explorer to enter the file manager interface. Select a file and then press Recall to recall the file.
2. To Limit
Selects the limit line file and recalls it to the selected limit line.
FMT (only available for RTSA)
Press FMT to enter the FMT recalling menu.
1. Recall
Press File Explorer to enter the file manager interface. Select a file and then press Recall to recall the file.
2. To Mask
Selects the FMT file to recall it to the selected mask.
Save
RSA3000 allows you to save various types of files to the internal or external memory.
Press Save on the front panel to enter the file saving menu. The available file types include: State, Trace+State, Measurement Data, Limit, Screen Image, and FMT (only available for RTSA).
State
Press State to enter the state saving menu. The state can be saved to the register or the file.
1. Save
Press this key to save the current state in the default filename or user-defined filename.
The default state filename is determined by the following methods:
- If you haven't input a filename by pressing the Save As key, its default filename is state
.sta. Wherein, n refers to the file number of the filenames that are named based on the naming mode in the current file directory. The value of is the existing maximum file number plus 1. For example, if 3 files (state1.sta、state2.sta、state5.sta) exist in the current directory, then the new filename for the file that you want to save should be state6.sta by default. - If you have pressed the Save As key to input the filename abc, then the file is saved to be "abc.sta". After that, press the Save key again, another file is saved automatically with the filename "abc1.sta".
2. Save As
Press this key and then use the numeric keypad on the front panel to input the filename. Then, press Save to save the corresponding state file.
You can also touch the screen or use the mouse to touch or click the Save As menu, and then input the filename with the keypad.
3. Register1 through Register16
When any one of the items from Register1 to Register16 is selected, the current state of the instrument will be saved to the corresponding register. The register supports quick save and recalling instrument state. The register menu displays the time for saving the instrument state.
Trace+State
Press Trace+State to enter the trace+state saving menu. The state of the instrument and the selected trace can be saved to the register or the file.
1. Save
Press this key to save the current trace+state file in the default filename or user-defined filename.
The default filename is determined by the following methods:
- If you haven't input a filename by pressing the Save As key, its default filename is tracestate
.trs. Wherein, n refers to the file number of the filenames that are named based on the naming mode in the current file directory. The value of is the existing maximum file number plus 1. - If you have pressed the Save As key to input the filename abc, then the file is saved to be "abc.trs". After that, press the Save key again, another file is saved automatically with the filename "abc1.trs".
2. Save As
Press this key and then use the numeric keypad on the front panel to input the filename. Then, press Save to save the corresponding trace+state file.
You can also touch the screen or use the mouse to touch or click the Save As menu, and then input the filename with the keypad.
3. Save From Trace
Selects the trace to be saved. You can select any single trace from Trace1 to Trace6.
4. Register1 through Register16
When any one of the items from Register1 to Register16 is selected, the current state of the instrument will be saved to the corresponding register. The register supports quick save and loading instrument state. The register menu displays the time for saving the instrument state.
Measurement Data
Press Measurement Data to enter the measurement data saving menu. The selected measurement data type (e.g. trace, measurement results, peak table, or marker table) can be saved to the specified file. The data will be saved in .csv format. They are separated with a comma, and this is convenient for you to use the Excel to analyze the data.
1. Save
Press this key to save the currently selected type of measurement data in the default filename or user-defined filename.
The default filename is determined by the following methods:
- If you haven't input a filename by pressing the Save As key, its default filename is measdata
.csv. Wherein, n refers to the file number of the filenames that are named based on the naming mode in the current file directory. The value of is the existing maximum file number plus 1. - If you have pressed the Save As key to input the filename abc, then the file is saved to be "abc.csv". After that, press the key again, another file is saved automatically with the filename "abc1.csv".
2. Save As
Press this key and then use the numeric keypad on the front panel to input the filename. Then, press Save to save the corresponding Measurement Data file.
You can also touch the screen or use the mouse to touch or click the Save As menu, and then input the filename with the keypad.
3. Save From Trace
If the data to be saved are traces, select the trace to be saved. You can select any single trace from Trace1 to Trace6.
4. Data Type
Selects the measurement data type to be saved. The data types supported by the instrument include trace, peak table, marker table, and measurement results.
Limit
Press Limit to enter the limit line saving menu. The selected limit line is saved to the file.
1. Save
Press this key to save the currently selected limit line in the default filename or user-defined filename.
The default filename is determined by the following methods:
- If you haven't input a filename by pressing the Save As key, its default filename is limit
.csv. Wherein, n refers to the file number of the filenames that are named based on the naming mode in the current file directory. The value of is the existing maximum file number plus 1. - If you have pressed the Save As key to input the filename abc, then the file
is saved to be "abc.csv". After that, press the key again, another file is saved automatically with the filename "abc1.csv".
2. Save As
Press this key and then use the numeric keypad on the front panel to input the filename. Then, press Save to save the corresponding Limit file.
You can also touch the screen or use the mouse to touch or click the Save As menu, and then input the filename with the keypad.
3. Select Limit
Selects the limit line to be saved. You can select any single limit line from Limit1 to Limit6.
Screen Image
Press Screen Image to enter the screen saving menu.
1. Save
Press this key to save the current screen image in the default filename or user-defined filename.
The default filename is determined by the following methods:
- If you haven't input a filename by pressing the Save As key, its default filename is screen
.jpg. Wherein, n refers to the file number of the filenames that are named based on the naming mode in the current file directory. The value of is the existing maximum file number plus 1. - If you have pressed the Save As key to input the filename abc, then the file is saved to be "abc.jpg". After that, press the key again, another file is saved automatically with the filename "abc1.jpg".
2. Save As
Press this key and then use the numeric keypad on the front panel to input the filename. Then, press Save to save the corresponding Screen Image file.
You can also touch the screen or use the mouse to touch or click the Save As menu, and then input the filename with the keypad.
3. Screenshot Info
1) Format
Press this key to select the file format of the current screen image to be "JPEG", "BMP", or "PNG".
2) Color Type
Press this key to select the color of the current screen image to be "Normal" or "Inverted".
FMT (only available for RTSA)
Press FMT to enter the FMT file saving menu. Save the selected FMT file to the file.
1. Save
Press this key to save the currently selected FMT file in the default filename or user-defined filename.
The default filename is determined by the following methods:
- If you haven't input a filename by pressing the Save As key, its default filename is FMT
.csv. Wherein, n refers to the file number of the filenames that are named based on the naming mode in the current file directory. The value of is the existing maximum file number plus 1. - If you have pressed the Save As key to input the filename abc, then the file is saved to be "abc.csv". After that, press the key again, another file is saved automatically with the filename "abc1.csv".
2. Save As
Press this key and then use the numeric keypad on the front panel to input the filename. Then, press Save to save the corresponding FMT file.
You can also touch the screen or use the mouse to touch or click the Save As menu, and then input the filename with the keypad.
3. Select FMT
Selects the FMT to be saved.
Quick Save Path
Open the file explorer interface, and then select the corresponding path. Press the Quick Save Path softkey to set the current path to be the quick save path.
Chapter 7 Remote Control
You can control RSA3000 series spectrum analyzer through USB or LAN remote interface. This chapter introduces remote control and the control method.
Contents in this chapter:
■ Remote Control Overview
■ Remote Control via USB
■ Remote Control via LAN
Remote Control Overview
RSA3000 can be connected to the PC via the USB or LAN interface to set up communication and realize remote control through the PC. The remote control can be realized by using SCPI (Standard Commands for Programmable Instruments) commands. It can be realized through the following two methods:
1. User-defined programming
You can program and control the instrument by using the SCPI commands on the basis of NI-VISA (National Instrument – Virtual Instrument Software Architecture) library. For details about the SCPI commands and programming, refer to RSA3000 Programming Guide.
2. PC software
You can use the PC software (Ultra Sigma) to send the SCPI commands to remotely control the instrument.
This Chapter introduces in details how to use Ultra Sigma to send commands through each kind of interface to control the analyzer. Please refer to Ultra Sigma help documentation to install the software and the required components correctly. You can download the latest version of the software from www.rigol.com.
Note: When the instrument is in remote mode, the front panel keys (except the Power key 📋 and Esc) are locked. At this time, you can press Esc to exist the remote mode.
Remote Control via USB
1. Connect the load to the PC
Use a USB cable to connect the analyzer (USB Device) with the PC (USB Host).
2. Install the USB driver
The analyzer is a USBTMC device. After you connect the analyzer to the PC properly and power it on for the first time (the analyzer will be automatically configured with the USB interface). In this case, "Found New Hardware Wizard" dialog box appears on the PC. Please install "USB Test and Measurement Device (IVI)" according to the instructions.
3. Search for the device resource
Start up Ultra Sigma (here we assume that you have installed Ultra Sigma properly) and the software will automatically search for the resource currently connected to the PC. You can also click USB-TMC to search for the resource.
4. View the device resource
The resources found will appear under the "RIGOL Online Resource" directory, and the model number and USB interface information of the instrument will also be displayed.
For example, RSA3045 (USB0::0x1AB1::0xA4A9::L355010000000::INSTR).
5. Communication test
Right-click the resource name "RSA3045
(USB0::0x1AB1::0xA4A9::L355010000000::INSTR)" and select "SCPI Panel Control" to turn on the remote command control panel, through which you can send commands and read data. For details about the SCPI commands and programming, refer to RSA3000 Programming Guide
Remote Control via LAN
1. Connect the analyzer to the PC
Use the network cable to connect the analyzer to the PC or the local area network (LAN) where the PC resides.
2. Configure network parameters
Sets the network parameters according to the descriptions in "Interface → LAN".
3. Search for the device resource
Start up Ultra Sigma and click . Then, click in the pop-up
window, and the software starts searching for the analyzer resources connected to LAN. When a LAN resource is found, its name will be displayed in the resource box on the right side of the panel. Select the desired resource and click to add the resource.

Note: The IP address of the selected resource should be consistent with that of the LAN interface. If you want to remove the resource, please select the resource name, and then click to remove it.
4. View the device resource
The resources found are shown under the "RIGOL Online Resource" directory. For example, RSA3045 (TCPIP::172.16.3.194::INSTR).
5. Communication test
Right-click the resource name "RSA3045 (TCPIP::172.16.3.194::INSTR)" and select "SCPI Panel Control" to turn on the remote command control panel, through which you can send commands and read data.
6. Load LXI webpage
As the analyzer conforms to LXI CORE 2011 DEVICE standards, you can load LXI webpage through Ultra Sigma (right-click the instrument resource name and
select "LXI-Web"). Various important information about the instrument (including the model, manufacturer, serial number, description, MAC address, and IP address) will be displayed on the webpage.
Note: If you want to view or modify the network settings of this instrument, please click Network Settings and then a pop-up window is displayed. Input "rigol" ("rigol" must be in lowercase form, without quotation marks) in the user name and the password fields. Besides, you can click Security to reset the password.
Tip:
You can also directly input the IP address of the analyzer in the address bar of the PC browser to load the LXI webpage.
Chapter 8 Troubleshooting
The commonly encountered failures of the analyzer and their solutions are listed below. If the following problems occur, locate and resolve the problems according to the following steps. If the problems still persist, contact RIGOL and provide your instrument information to us. (For instrument information, press System → About System → System Info.)
1. When I power on the instrument, the analyzer stays black and does not display anything.
(1) Check whether the fan works normally.
— If the fan works normally, but the screen stays black, check whether the connecting cable that connects the screen is loose.
— If the fan does not work normally, it indicates that the instrument has failed to start up. Please handle it according to the method specified in Step (2).
(2) Check the power source.
— Check whether the power supply has been connected correctly and the power switch has been turned on.
— Check whether the fuse is burned. If you need to replace the fuse, please use the specified fuse (AC 250V, T3.15A).
2. One or more keys on the keyboard does/do not respond, and stuck keys are found.
(1) After you power on the instrument, check whether all the keys are unresponsive.
(2) Press System → About System → Self Test → Keyboard, and check whether there are unresponsive keys or stuck keys.
(3) If the above problems are found, check whether the keyboard cables are loose or the keypad is damaged. Do not disassemble the instrument by yourself, please contact RIGOL.
3. The spectral lines on the screen haven't been updated for a long time.
(1) Check whether the screen is locked or not. If yes, press Esc to unlock it.
(2) Check whether all the trigger conditions have been met and whether there is a valid trigger signal.
(3) Check whether the analyzer is in single sweep.
(4) Check whether the set current sweep time is too long.
4. Errors or poor precision were found in the measurement results.
To calculate the system errors and check the measurement results/precision, refer to the introductions in the "Specifications". To achieve the requirements of the specifications specified in this manual, perform the following operations.
(1) Check whether all the external devices are successfully connected and are working normally.
(2) Get an understanding about the signal under test, and configure appropriate parameters for the instrument.
(3) Make measurements under proper conditions. For example, warm up the instrument for a while, or operate the instrument under the specified working temperature.
(4) Calibrate the instrument regularly to reduce or avoid measurement errors that might occur due to device aging.
— If you need calibration after the stated calibration period expires, contact RIGOL or get paid service from authorized measurement agencies.
— The analyzer provides self-calibration function. If required, press System → Alignment → Align Auto and select "On". The analyzer will perform one self-calibration after being started.
— Press System → Alignment → Align Now to make a self-calibration immediately.
5. Prompt Message
A prompt message will be displayed based on its working state, such as the tip message, error message, or state message. These messages are displayed to help you use the instrument properly, and do not indicate that there is something wrong with the instrument.
Chapter 9 Appendix
Appendix A: RSA3000 Accessories and Option List
| Description | Order No. | |
| Model | Real-time Spectrum Analyzer, 9 kHz to 3 GHz | RSA3030 |
| Real-time Spectrum Analyzer, 9 kHz to 4.5 GHz | RSA3045 | |
| Real-time Spectrum Analyzer, 9 kHz to 3 GHz (with TG installed when leaving the factory) | RSA3030-TG | |
| Real-time Spectrum Analyzer, 9 kHz to 4.5 GHz(with TG installed when leaving the factory) | RSA3045-TG | |
| Real-time Spectrum Analyzer, 9 kHz to 1.5 GHz (with TG installed when leaving the factory, VNA supported) | RSA3015N | |
| Real-time Spectrum Analyzer, 9 kHz to 3 GHz (with TG installed when leaving the factory, VNA supported) | RSA3030N | |
| Real-time Spectrum Analyzer, 9 kHz to 4.5 GHz (with TG installed when leaving the factory, VNA supported) | RSA3045N | |
| Standard Accessories | Quick Guide (hard copy) | - |
| Power Cord | - | |
| EMI Measurement Application (includes RSA3000-EMC) | RSA3000-EMI | |
| Option | Preamplifier (PA) | RSA3000-PA |
| High Stability Clock | OCXO-C08 | |
| RBW 1 Hz to 10 MHz | RSA3000-BW1 | |
| Real-time Analysis Bandwidth 25 MHz | RSA3000-B25 | |
| Real-time Analysis Bandwidth 40 MHz | RSA3000-B40 | |
| EMC Filter and Quasi-Peak Detector Kit | RSA3000-EMC | |
| Advanced Measurement Kit | RSA3000-AMK | |
| Spectrum Analyzer PC Software | Ultra Spectrum | |
| EMI Pre-compliance Test Software | S1210 EMIPre-compliance Software | |
| Optional Accessories | Include: N-SMA cable, BNC-BNC cable, N-BNC adaptor, N-SMA adaptor, 75 Ω-50 Ω adaptor, 900 MHz/1.8 GHz antenna (2pcs), 2.4 GHz antenna (2pcs) | DSA Utility Kit |
| Include: N(F)-N(F) adaptor (1pcs), N(M)-N(M) adaptor (1pcs), N(M)-SMA(F) adaptor (2pcs), N(M)-BNC(F) adaptor (2pcs), SMA(F)-SMA(F) adaptor (1pcs), SMA(M)-SMA(M) adaptor (1pcs), BNC T type adaptor (1pcs), 50 Ω SMA load (1pcs), 50 Ω BNC impedance adaptor (1pcs) | RF Adaptor Kit | |
| High-performance Network Analysis Calibration Kit (frequency range: DC to 6.5 GHz) | CK106A | |
| Economical Network Analysis Calibration Kit (frequency range: DC to 1.5 GHz) | CK106E | |
| Include: 50 Ω to 75 Ω adaptor (2pcs) | RF CATV Kit | |
| Include: 6 dB attenuator (1pcs), 10 dB attenuator (2pcs) | RF Attenuator Kit | |
| 30 dB high-power attenuator, with the max power of 100 W | ATT03301H | |
| N(M)-N(M) RF Cable | CB-NM-NM-75-L-12G | |
| N(M)-SMA(M) RF Cable | CB-NM-SMAM-75-L-12G | |
| VSWR Bridge, 1 MHz to 3.2 GHz | VB1032 | |
| VSWR Bridge, 2 GHz to 8 GHz | VB1080 | |
| Near-field Probe | NFP-3 | |
| Rack Mount Kit | RM6041 | |
| USB Cable | CB-USBA-USBB-FF-150 |
Note: For more details about the accessories and the options, please contact RIGOL sales representatives or the local distributors.
Appendix B: Warranty
RIGOL TECHNOLOGIES CO., LTD. (hereinafter referred to as RIGOL) warrants that the product will be free from defects in materials and workmanship within the warranty period. If a product proves defective within the warranty period, RIGOL guarantees free replacement or repair for the defective product.
To get repair service, please contact with your nearest RIGOL sales or service office.
There is no other warranty, expressed or implied, except such as is expressly set forth herein or other applicable warranty card. There is no implied warranty of merchantability or fitness for a particular purpose. Under no circumstances shall RIGOL be liable for any consequential, indirect, ensuing, or special damages for any breach of warranty in any case.
Index
3rd Order Lower 2-62
3rd Order Upper 2-62
ACP....2-35, 2-45
Acq Times/Trigger 3-11
Adjacent Channel Bandwidth ..... 2-46
AM 4-2
Auto 6-3
Auto Search 5-1
Average (RMS) 2-27
Average Mode 2-43
Average Power 2-43
Avg Number 2-42
Base Lower 2-62
Base Upper 2-62
C/N Ratio 2-36, 2-57
Cal Open 2-65
Carrier BW 2-59
Carrier Power 2-57
Center Frequency 2-3
CF step 2-5
Channel Power 2-48
Channel Spacing 2-47
Clear Write 2-26
Cont Peak 2-80
Delta Marker 2-67
Demod Time 4-2
demodulation type 4-2
Density 3-19
Density Spectrogram 3-21
DHCP....6-2
Display Line 6-4
Earphone 4-2
EBW 2-36, 2-54
EBW X dB 2-55
FM 4-2
FMT....3-12
Free Run 2-22
Full Span.... 2-9
Gateway 6-3
Graticule Brightness 6-5
Harmonic Distortion 2-36
Harmonic ST 2-61
IF Power Trigger 3-11
Input Attenuation....2-10
Input Impedance 4-1
Intercept 2-62
IP 6-3
ITime....2-70
Keyboard Test 6-6
LAN 6-2
Last Span 2-8, 3-3
Main Channel Bandwidth 2-46
Main Channel Power 2-45
Manual IP 6-3
Marker Table 2-71
Marker Trace....2-68
Mask Type 3-12
Max Hold 2-26, 2-52, 2-55
Min Hold....2-26
Mkr->CF 2-73
Mkr->Ref.....2-74
Mkr->Start.... 2-73
Mkr->Step 2-73
Mkr->Stop 2-73
MkrΔ->CF....2-74
Mkr Δ ->Span....2-74
Multi-channel Power 2-35
Multi-point Touch 6-6
N dB Bandwidth 2-75
Next Peak 2-79
Next Peak Left 2-79
Next Peak Right 2-79
No. of Harmo 2-61
Noise BW 2-58
Noise Power 2-57
Normal....3-18
Normalization Reference Level .... 2-33
Normalize....2-33
OBW 2-36, 2-51
OCXO....1-16
Offset Frequency 2-58
Peak Power 2-43
Peak Table 2-82
Pk-Pk Search....2-80
Power On 6-1
Power Ratio 2-53
Power Spectral Density 2-48
Preset 5-3, 6-1
Preset Type 6-1
PvT 3-22
PvT Spectrogram 3-24
PvT Spectrum 3-23
RBW.... 2-14
Readout 2-69
Reference Level 2-9
Reference Level Offset 2-13
Reference Marker 2-67
Reference Position 2-34
Reference Trace.... 2-34
Reset 2-64
RMS 2-43
Sample 2-27
Save Preset 6-1
Save Ref Trace 2-34
Scale Type 2-12
Screen Test 6-6
Signal Track 2-6
Single-point Touch 6-6
Span 2-8, 2-52, 2-63, 3-2
Spectrogram 3-20
Start Freq 2-4
Start Line 2-43
Stop Freq 2-4
Stop Line 2-43
Subnet Mask 6-3
Sweep Time 2-18
System Info 6-5
TOI 2-36
TP Type.... 2-43
T-Power 2-35, 2-42
Tracking Generator 2-32
USB 6-4
VBW 2-14
VBW/RBW Ratio 2-16
Video 2-22
Video Bandwidth 2-14
Volume 4-2
VSWR 2-37, 2-65
VSWR Ref Level 2-65
Y Axis Unit.... 2-11
Zero Span 2-9


- RSA3000 SERIES REAL-TIME SPECTRUM ANALYZER
- GUARANTY AND DECLARATION
- COPYRIGHT
- TRADEMARK INFORMATION
- PUBLICATION NUMBER
- SOFTWARE VERSION
- NOTICES
- PRODUCT CERTIFICATION
- CONTACT US
- SAFETY REQUIREMENT
- GENERAL SAFETY SUMMARY
- USE PROPER POWER CORD
- GROUND THE INSTRUMENT
- CONNECT THE PROBE CORRECTLY
- OBSERVE ALL TERMINAL RATINGS
- USE PROPER OVERVOLTAGE PROTECTION
- DO NOT OPERATE WITHOUT COVERS
- DO NOT INSERT OBJECTS INTO THE AIR OUTLET
- USE PROPER FUSE
- AVOID CIRCUIT OR WIRE EXPOSURE
- DO NOT OPERATE WITH SUSPECTED FAILURES
- PROVIDE ADEQUATE VENTILATION
- DO NOT OPERATE IN WET CONDITIONS
- DO NOT OPERATE IN AN EXPLOSIVE ATMOSPHERE
- KEEP PRODUCT SURFACES CLEAN AND DRY
- PREVENT ELECTROSTATIC IMPACT
- USE THE BATTERY PROPERLY
- HANDLE WITH CAUTION
- SAFETY NOTICES AND SYMBOLS
- SAFETY NOTICES IN THIS MANUAL
- WARNING
- CAUTION
- SAFETY TERMS ON THE PRODUCT
- DANGER
- SAFETY SYMBOLS ON THE PRODUCT
- CARE AND CLEANING
- CARE
- CLEANING
- ENVIRONMENTAL CONSIDERATIONS
- PRODUCT END-OF-LIFE HANDLING
- RSA3000 SERIES OVERVIEW
- MAIN FEATURES
- DOCUMENT OVERVIEW
- TOPICS IN THIS MANUAL
- CHAPTER 1 QUICK START
- CHAPTER 2 FUNCTIONS OF THE FRONT PANEL OF GPSA
- CHAPTER 3 FUNCTIONS OF THE FRONT PANEL OF RTSA
- CHAPTER 4 INPUT/OUTPUT
- CHAPTER 5 SHORTCUT KEY
- CHAPTER 6 SYSTEM FUNCTION
- CHAPTER 7 REMOTE CONTROL
- CHAPTER 8 TROUBLESHOOTING
- CHAPTER 9 APPENDIX
- FORMAT CONVENTIONS IN THIS MANUAL
- KEYS
- MENU KEYS
- CONNECTORS
- OPERATION PROCEDURES
- CONTENT CONVENTIONS IN THIS MANUAL
- USER MANUALS OF THIS PRODUCT
- CONTENTS
- GUARANTY AND DECLARATION ....I
- SAFETY REQUIREMENT ...... II
- RSA3000 SERIES OVERVIEW...... VI
- DOCUMENT OVERVIEW......VII
- INDEX
- CONTENTS IN THIS CHAPTER
- GENERAL INSPECTION
- INSPECT THE PACKAGING
- INSPECT THE INSTRUMENT
- CHECK THE ACCESSORIES
- APPEARANCE AND DIMENSIONS
- TO PREPARE FOR USE
- TO ADJUST THE SUPPORTING LEGS
- TO CONNECT TO AC POWER
- TURN-ON CHECKOUT
- SELF-CALIBRATION
- TO SET THE SYSTEM LANGUAGE
- FRONT PANEL
- FUNCTION KEYS ON THE FRONT PANEL
- TIP
- UTILITY FUNCTION KEYS ON THE FRONT PANEL
- FRONT PANEL KEY BACKLIGHT
- POWER KEY
- AUTO TUNE
- TRACKING GENERATOR
- SINGLE
- KEYPAD LOCKING KEY
- TOUCH SCREEN LOCKING KEY
- FRONT PANEL CONNECTOR
- USB HOST
- USB STORAGE DEVICE
- MOUSE
- KEYBOARD
- EARPHONE JACK
- GEN OUTPUT 50Ω
- RF INPUT 50Ω
- TO USE THE NUMERIC KEYPAD
- NUMBER/LETTER
- REAR PANEL
- AC POWER CORD CONNECTOR
- FUSE HOLDER
- OCXO (OPTION)
- HANDLE
- MHZ IN
- MHZ OUT
- TRIGGER IN/OUT
- TRIGGER IN
- LAN
- USB DEVICE
- HDMI
- IF OUT
- MOUSE/KEYBOARD/TOUCH SCREEN OPERATION RULE
- MOUSE OPERATION RULE
- KEYBOARD OPERATION RULE
- TOUCH SCREEN OPERATION RULE
- MENU OPERATION
- PARAMETER INPUT
- STATE SWITCHING
- ENTER LOWER-LEVEL MENU (WITH PARAMETER)
- LOWER-LEVEL MENU (WITHOUT PARAMETER)
- DIRECT EXECUTION
- STATE SELECTION
- PARAMETER SETTING
- USE THE NUMERIC KEYS
- USE THE KNOB
- USE THE ARROW KEYS
- USE THE TOUCH SCREEN
- USE THE KEYBOARD
- USE THE MOUSE
- TO USE THE BUILT-IN HELP SYSTEM
- GET THE BUILT-IN HELP INFORMATION
- PAGE UP/DOWN OPERATION
- CLOSE THE CURRENT HELP INFORMATION
- GET THE HELP INFORMATION OF THE MENU KEY
- GET THE HELP INFORMATION OF ANY FUNCTION KEY
- FUSE REPLACEMENT
- MODE SETTING
- MODE
- GPSA
- RTSA
- MODE SETUP
- GLOBAL CF MODE
- GLOBAL CF
- MODE PRESET
- BASIC SETTINGS
- FREQ
- CENTER FREQ
- REMARKS
- START FREQ
- STOP FREQ
- CF STEP
- CF STEP MODE
- FREQ OFFSET
- SIGNAL TRACK
- SPAN
- LAST SPAN
- FULL SPAN
- ZERO SPAN
- AMPT
- REF LEVEL
- ATTENUATION
- ATTEN AUTO
- RF PREAMP
- Y AXIS UNIT
- SCALE TYPE
- SCALE/DIV
- MAX MIXER LVL
- REF OFFSET
- SWEEP AND FUNCTION SETTINGS
- BW
- RBW
- RBW MODE
- SPAN/RBW RATIO
- SPAN/RBW MODE
- VBW
- VBW MODE
- VBW/RBW RATIO
- VBW/RBW MODE
- FILTER TYPE
- SWEEP
- SWEEP POINTS
- SWEEP TIME
- SWEEP TIME MODE
- SWEEP TIME RULE
- CONTINUE
- TRIGGER
- TRIGGER SOURCE
- FREE RUN
- EXTERNAL
- VIDEO
- SLOPE
- TRIGGER DELAY SWITCH
- TRIG DELAY
- TRIGGER LEVEL
- TRIGGER HOLDOFF SWITCH
- TRIGGER HOLDOFF
- AUTO TRIG SWITCH
- AUTO TRIG
- TRACE
- TRACE SELECTION
- TRACE TYPE
- CLEAR WRITE
- AVERAGE
- MAX HOLD
- MIN HOLD
- DETECTOR TYPE
- POS PEAK
- NEG PEAK
- NORMAL
- SAMPLE
- AVERAGE (RMS)
- AVERAGE (VOL)
- QUASI PEAK (OPTION)
- DETECTOR AUTO
- TRACE UPDATE
- TRACE DISPLAY
- MATH FUNCTION
- OP1-OP
- OP1+OP
- OP1+OFFSET
- OP1-OFFSET
- OP1-OP2+REF
- OFF
- OP
- OFFSET
- REFERENCE
- PRESET ALL
- CLEAR ALL
- AMPLITUDE
- AMPLITUDE OFFSET
- NORMALIZE
- REFERENCE LEVEL
- REFERENCE POSITION
- REFERENCE TRACE
- SAVE REF TRACE
- MEASUREMENT SETTINGS
- MEAS
- SWEPT SA
- ADVANCED MEASUREMENT FUNCTION (AMK)
- MEAS OFF
- T-POWER
- ACP
- MULTICHAN PWR
- OCCUPIED BW
- EMISSION BW
- C/N RATIO
- HARMO DIST
- TOI
- VSWR
- MEAS SETUP
- AVG NUMBER
- AVG MODE
- AVG STATE
- LIMIT
- TEST LIMITS
- SELECT LIMIT
- LIMIT STATE
- EDIT LIMIT
- TEST TRACE
- DELETE LIMIT
- DELETES ALL LIMITS
- AUTO COUPLE
- MEAS PRESET
- TIME-DOMAIN POWER (T-POWER)
- MEASUREMENT INTERFACE
- TP TYPE
- PEAK
- RMS
- START LINE
- STOP LINE
- MAIN CHAN BW
- ADJ CHAN BW
- CHAN SPACING
- EDIT CHANNEL
- CHANNEL SHEET
- NAVIGATIONS
- CHANNEL FREQUENCY
- CHANNEL SPAN
- ADD CHANNEL
- DELETE CHANNEL
- DELETES ALL CHANNELS
- OBW SPAN
- POWER RATIO
- EMISSION BANDWIDTH (EBW)
- EBW SPAN
- EBW X DB
- C/N RATIO (CNR)
- OFFSET FREQ
- NOISE BW
- CARRIER BW
- HARMO DIST (THD)
- NO. OF HARMO
- HARMONIC ST
- THIRD-ORDER INTERCEPT (TOI)
- MEASUREMENT RESULTS
- TOI SPAN
- RESET
- CAL OPEN
- SELECTED MARKER
- MARKER MODE
- MARKER FREQ
- REF VALUE
- MARKER MEASUREMENT
- MARKER
- POSITION
- DELTA
- APPLICATION OF THE "DELTA" MARKER
- FIXED
- REFERENCE MARKER
- MARKER TRACE
- MARKER TRACE AUTO
- MARKER FREQ | TIME
- MARKER AMPLITUDE
- MARKER READOUT
- FREQUENCY
- TIME
- I/TIME
- PERIOD
- READOUT AUTO
- LINE STATE
- COUPLE MARKERS
- MARKER TABLE
- MARKER ALL OFF
- MARKER TO
- MKR->CF
- MKR->CF STEP
- MKR->START
- MKR->STOP
- MKR->REF
- MKRΔ->CF
- MKRΔ->SPAN
- MARKER FUNCTION
- N DB STATE
- N DB BANDWIDTH
- BAND FUNCTION
- NOISE
- BAND POWER
- BAND DENSITY
- BAND ADJUST
- BAND SPAN
- BAND LEFT
- BAND RIGHT
- BAND SPAN AUTO
- MARKER COUNTER
- GATE TIME
- GATE TIME AUTO
- PEAK SEARCH
- NEXT PEAK
- NEXT PEAK RIGHT
- NEXT PEAK LEFT
- MINIMUM SEARCH
- PK-PK SEARCH
- CONT PEAK
- DIFFERENCE BETWEEN CONT PEAK AND SIGNAL TRACK
- PEAK CONFIG
- PEAK THRESHOLD
- THRESHOLD STATE
- PEAK EXCURSION
- EXCURSION STATE
- THRESHOLD LINE
- SEARCH MODE
- PEAK TABLE
- PEAK TABLE SORT
- PK TABLE READOUT
- DISPLAY LINE
- SPAN (ACQ BW)
- REF VALUE (PVT)
- SCALE/DIV (PVT)
- REF POSITION (PVT)
- AUTO SCALE (PVT)
- REF LEVEL (PVT)
- RBW AUTO
- ACQ TIME
- ACQ TIME AUTO
- ACQ TIME (PVT)
- ACQ TIME AUTO (PVT)
- ACQ/TRIGGER
- POWER TRIGGER
- POWER
- FMT
- MASK TYPE
- MASK EDIT
- ACTIVE MASK
- NAVIGATION
- INSERT POINT
- DELETE POINT
- DELETE MASK
- BUILD FROM TRACE
- BUILD
- EXPORT
- IMPORT
- RECALL
- TO MASK
- NEW MASK
- X OFFSET
- Y OFFSET
- APPLY OFFSET
- X AXIS TYPE
- Y AXIS TYPE
- TRIGGER MASK
- TRIGGER CRITERIA
- TRACE DETECTOR
- TRACE DETECTOR (PVT)
- DETECTOR AUTO (PVT)
- TRACE UPDATE (PVT)
- TRACE DISPLAY (PVT)
- PRESET ALL (PVT)
- CLEAR ALL (PVT)
- DENSITY
- SPECTROGRAM
- DENSITY SPECTROGRAM
- PVT
- PVT SPECTRUM
- PVT SPECTROGRAM
- SSC
- DENSITY PARAMETERS
- PERSISTENCE
- PERSISTENCE INFINITE
- COLOR PALETTES
- HIGHEST DENSITY HUE
- LOWEST DENSITY HUE
- CURVE NONLINEARITY
- AUTO ADJUST COLOR
- HUE TRUNCATE
- SPECTROGRAM PARAMETERS
- DISPLAY TRACE
- COUPLE MARKER TRACE
- REF HUE
- REF HUE POS
- BOTTOM HUE POS
- AUTO ADJUST HUE
- MARK LINE1 STATE
- MARK LINE
- MARK LINE2 STATE
- PASS/FAIL
- LIMIT EDIT
- MARKER SETUP
- MARKER Z
- INPUT IMPEDANCE
- EXT GAIN
- EXT TRIGGER
- DEMOD
- DEMOD SETUP
- EARPHONE
- VOLUME
- DEMOD TIME
- SIGNAL GAIN STATE
- SIGNAL GAIN
- PRESET
- USER
- QUICK SAVE
- CONT
- SYSTEM
- POWER ON
- PRESET TYPE
- SAVE USER PRESET
- ALIGNMENT
- ALIGN NOW
- ALIGN AUTO
- INTERFACE
- IP
- SUBNET MASK
- GATEWAY
- DNS
- APPLY
- USB
- DISPLAY
- DISPLAY LINE STATE
- GRATICULE
- HDMI RESOLUTION
- LCD
- LCD BACKLIGHT
- ABOUT SYSTEM
- SYSTEM INFO
- OPTION INFO
- SELF TEST
- SCREEN
- MULTI-POINT TOUCH
- SINGLE-POINT TOUCH
- LICENSE INFO
- ONLINE UPDATE
- DATE/TIME
- SET TIME
- SET DATE
- SECURITY CLEAR
- LANGUAGE
- SETTINGS
- POWER SWITCH
- BEEP SWITCH
- USER KEY
- SCPI DISPLAY
- MESSAGES
- SELECT ALL
- SELECT READ
- SELECT UNREAD
- DELETE
- QUERY ALL
- QUERY READ
- QUERY UNREAD
- FILE
- FILE EXPLORER
- COPY
- PASTE
- RENAME
- NEW FOLDER
- QUICK PRINT
- PRINTER SETUP
- PRINTER PARAMETERS
- ADD DEVICE
- SELECT DEVICE
- IMPORT LICENSE
- SYSTEM UPDATE
- STATE
- REGISTER1 THROUGH REGISTER
- TRACE+STATE
- TO TRACE
- MEASUREMENT DATA
- TO LIMIT
- FMT (ONLY AVAILABLE FOR RTSA)
- SAVE
- SAVE AS
- SAVE FROM TRACE
- DATA TYPE
- SCREEN IMAGE
- SCREENSHOT INFO
- FORMAT
- COLOR TYPE
- SELECT FMT
- QUICK SAVE PATH
- REMOTE CONTROL OVERVIEW
- USER-DEFINED PROGRAMMING
- PC SOFTWARE
- REMOTE CONTROL VIA USB
- CONNECT THE LOAD TO THE PC
- INSTALL THE USB DRIVER
- SEARCH FOR THE DEVICE RESOURCE
- VIEW THE DEVICE RESOURCE
- COMMUNICATION TEST
- REMOTE CONTROL VIA LAN
- CONNECT THE ANALYZER TO THE PC
- CONFIGURE NETWORK PARAMETERS
- LOAD LXI WEBPAGE
- WHEN I POWER ON THE INSTRUMENT, THE ANALYZER STAYS BLACK AND DOES NOT DISPLAY ANYTHING
- ONE OR MORE KEYS ON THE KEYBOARD DOES/DO NOT RESPOND, AND STUCK KEYS ARE FOUND
- THE SPECTRAL LINES ON THE SCREEN HAVEN'T BEEN UPDATED FOR A LONG TIME
- ERRORS OR POOR PRECISION WERE FOUND IN THE MEASUREMENT RESULTS
- PROMPT MESSAGE
- APPENDIX B: WARRANTY
Brand : Rigol
Model : RSA3015N
Category : Measuring equipment