
Core i5-6400 - Processor INTEL - Free user manual and instructions
Find the device manual for free Core i5-6400 INTEL in PDF.


| Product Type | Processor |
| Brand | Intel |
| Model | Core i5-6400 |
| Socket | LGA 1151 |
| Cores | 4 |
| Threads | 4 |
| Base Frequency | 2.7 GHz |
| Max Turbo Frequency | 3.3 GHz |
| Cache | 6 MB SmartCache |
| Thermal Design Power (TDP) | 65 W |
| Manufacturing Process | 14 nm |
| Integrated Graphics | Intel HD Graphics 530 |
| Max Memory Support | DDR4-2133, DDR3L-1600 |
| Max Memory Capacity | 64 GB (depending on motherboard) |
| PCIe Lanes | 16 (version 3.0) |
| Operating Temperature | 0°C to 72°C |
| Dimensions (approx) | 37.5 mm x 37.5 mm |
| Weight (approx) | 10–20 g |
| Power Supply | Via motherboard VRM (no separate connector) |
| Maintenance | Clean with isopropyl alcohol; avoid static discharge |
| Safety | Use compatible motherboard; ensure adequate cooling |
| Spare Parts | Not user-serviceable; thermal paste may be replaced |
| Repairability | Not repairable; replace if defective |
Frequently Asked Questions - Core i5-6400 INTEL
User questions about Core i5-6400 INTEL
0 question about this device. Answer the ones you know or ask your own.
Ask a new question about this device
Download the instructions for your Processor in PDF format for free! Find your manual Core i5-6400 - INTEL and take your electronic device back in hand. On this page are published all the documents necessary for the use of your device. Core i5-6400 by INTEL.
USER MANUAL Core i5-6400 INTEL
6th Generation Intel® Core™ Processor Family Uncore Performance Monitoring Reference Manual
April 2016
Intel technologies features and benefits depend on system configuration and may require enabled hardware, software, or service activation. Learn more at intel.com, or from the OEM or retailer.
No computer system can be absolutely secure. Intel does not assume any liability for lost or stolen data or systems or any damages resulting from such losses.
You may not use or facilitate the use of this document in connection with any infringement or other legal analysis concerning Intel products described herein. You agree to grant Intel a non-exclusive, royalty-free license to any patent claim thereafter drafted which includes subject matter disclosed herein.
No license (express or implied, by estoppel or otherwise) to any intellectual property rights is granted by this document.
The products described may contain design defects or errors known as errata which may cause the product to deviate from published specifications. Current characterized errata are available on request.
Intel disclaims all express and implied warranties, including without limitation, the implied warranties of merchantability, fitness for a particular purpose, and non-infringement, as well as any warranty arising from course of performance, course of dealing, or usage in trade. Intel Enhanced Intel SpeedStep Technology, Pentium, and the Intel logo are trademarks of Intel Corporation in the United States and/or other countries.
Copies of documents which have an order number and are referenced in this document may be obtained by calling 1-800-548-4725 or by visiting www.intel.com/design/literature.htm.
* Other names and brands may be claimed as the property of others.
Copyright © 2016, Intel Corporation. All Rights Reserved.
Contents
1 Introduction....5
1.1 Uncore PMU Overview....5
1.2 Changes from 5th Generation Intel® Core™ Processor to 6th Generation Intel® Core™ Processor....6
1.2.1 MSR Addresses 6
1.3 Uncore PMU Counter Summary 6
2 Uncore Performance Monitoring Facilities....9
2.1 Uncore PMU MSR Listing....9
2.2 Uncore PMU Global Registers 10
2.2.1 MSR_UNC_PERF_GLOBAL_CTRL 10
2.2.2 MSR_UNC_PERF_GLOBAL_STATUS 11
2.3 Fixed Counter Registers 11
2.3.1 MSR_UNC_PERF_FIXED_CTRL 11
2.3.2 MSR UNC PERF FIXED CTR 12
2.4 Uncore CBo and ARB PMU Registers 12
2.4.1 MSR_UNC_CBO_CONFIG.... 12
2.4.2 Performance Event Select Registers.... 12
2.4.3 Performance Counter Registers 14
3 6th Generation Intel® Processor Uncore Performance Monitoring Events ......15
3.1 CBo Uncore PerfMon Events.... 15
3.2 ARB Uncore PerfMon Events.... 16
3.3 IMC Events.... 17
4 Terminology....19

Figures
1-1 6th Generation Intel® Core™ Processor Uncore Block Diagram....6
Tables
1-1 MSR Changes to 6th Generation Intel® Core™ Processors 6
1-2 6th Generation Intel® Core™ Processor Uncore Counter Summary 7
2-1 Uncore PMU MSR List 9
2-2 MSR_UNC_PERF_GLOBAL_CTRL Definition 10
2-3 MSR_UNC_PERF_GLOBAL_STATUS Definition 11
2-4 MSR UNC PERF FIXED CTRL Definition....11
2-5 MSR_UNC_PERF_FIXED_CTR Definition 12
2-6 MSR UNC CBO CONFIG Definition 12
2-7 MSR UNC CBO 0 PERFEVTSEL0 Definition 13
2-8 MSR UNC CBO 0 PERFCTR0 Definition 14
3-1 Uncore PMU MSR List 15
3-2 ARB PerfMon Events 16
3-3 IMC Counters....17
4-1 List of Terms....19
1 Introduction
This is a programmer's reference manual for the uncore performance monitoring units (PMU) on the 6th generation Intel® Core™ processor and the Intel® Pentium® Processor Family based on the S-Platform. This reference manual details the uncore performance monitoring hardware registers and events.
The material in this document does not apply to Intel ^® Xeon ^™ processors.
1.1 Uncore PMU Overview
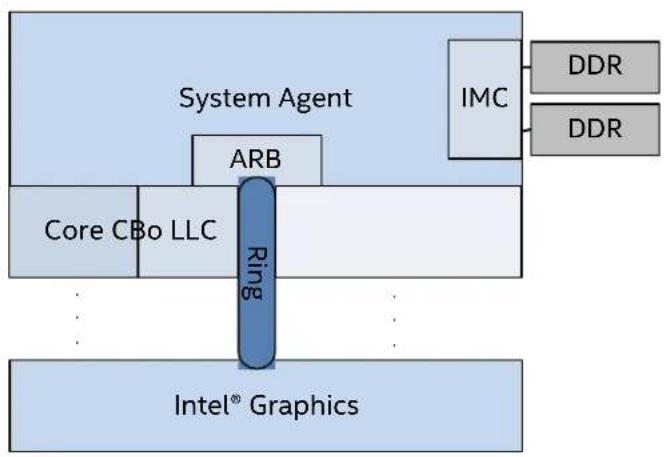
The uncore PMU employs a distributed design where counters are implemented within the various uncore units. Counters in one unit cannot count events of a different unit. The uncore units covered in this document are the C-box (CBo), arbitration (ARB) unit and integrated memory controller (IMC).
The uncore PMU provides a unified last level cache (LLC) that can support up to four processor cores. The LLC consists of multiple slices where each slice interfaces with a processor via a coherency engine, referred to as a C-Box, or CBo. Each CBo provides MSRs to select uncore performance monitoring events, which are called event select MSRs. Each event select MSR is paired with a counter register where event counts are accumulated.
The ARB unit provides local performance counters and event select MSRs for ARB unit specific events. There is also a fixed or non-programmable counter in the ARB that counts uncore clock cycles.
The IMC unit of the 6th Generation Intel Processor contains five model specific, fixed counters that allow for monitoring the number of requests to DRAM.
The block diagram below provides a visual representation of the CBo and ARB units of the 6th generation Intel Core processor.
Figure 1-1. 6th Generation Intel ^ Core ^TM Processor Uncore Block Diagram
flowchart
graph TD
    A["Intel® Graphics"] --> B["Core CBo LLC"]
    B --> C["Ring"]
    C --> D["System Agent"]
    D --> E["IMC"]
    E --> F["DDR"]
    D --> G["DDR"]
    style A fill:#cce5ff,stroke:#333
    style B fill:#cce5ff,stroke:#333
    style C fill:#66ccff,stroke:#333
    style D fill:#e6f2ff,stroke:#333
    style E fill:#e6f2ff,stroke:#333
    style F fill:#e6f2ff,stroke:#333
    style G fill:#e6f2ff,stroke:#333
1.2 Changes from 5th Generation Intel ^® Core ^TM Processor to 6th Generation Intel ^® Core ^TM Processor
This section details the changes from 5th generation Intel Core processors to 6th generation Intel Core processors that are relevant to uncore performance monitoring.
1.2.1 MSR Addresses
Two critical MSR addresses have changed from 5th generation Intel Core processors to 6th generation Intel Core processors. Uncore performance monitoring software drivers from 5th generation Intel Core processors will need to update MSR addresses in order to function correctly on 6th generation Intel Core processors.
Table 1-1. MSR Changes to 6th Generation Intel ^ Core ^TM Processors
| Register Name | 5th Generation Intel Core Processor MSR Address | 6th Generation Intel Core Processor MSR Address |
| MSR_UNC_PERF_GLOBAL_CTRL 0x391 0xE01 | ||
| MSR_UNC_PERF_GLOBAL_STATUS 0x392 0xE02 |
1.3 Uncore PMU Counter Summary
The following table lists the available programmable counters in the uncore PMU. CBo events have restrictions on which CBo counter can be used. Specifics on these restrictions are detailed in the 6th generation Intel Core processor uncore performance monitoring events section.
Table 1-2. 6th Generation Intel ^ Core ^TM Processor Uncore Counter Summary
| Unit Number of Counters Instances Bit Width | |||
| CBo 2 1 to 4 44 | |||
| A | R | B | 2 |
| F | i | x | e |
| I | M | C | F |
2 Uncore Performance Monitoring Facilities
The uncore PMU provides global control and status registers for all resources in the CBo and ARB units as well as unit level control and status registers. This section details the MSRs of the uncore PMU.
2.1 Uncore PMU MSR Listing
The table below lists the register names and their MSR address for the registers associated with the uncore performance monitoring facilities. The following sections after the table provide definitions of each register and field values.
Table 2-1. Uncore PMU MSR List
| Register Name MSR Address | |
| MSR_UNC_PERF_GLOBAL_CTRL E01H | |
| MSR_UNC_PERF_GLOBAL_STATUS E02H | |
| MSR_UNC_PERF_FIXED_CTRL 394H | |
| MSR_UNC_PERF_FIXED_CTR 395H | |
| MSR_UNC_CBO_CONFIG 396H | |
| MSR_UNC_ARB_PERFCTR0 3B0H | |
| MSR_UNC_ARB_PERFCTR1 3B1H | |
| MSR_UNC_ARB_PERFEVTSEL0 3B2H | |
| MSR_UNC_ARB_PERFEVTSEL1 3B3H | |
| MSR_UNC_CBO_0_PERFEVTSEL0 700H | |
| MSR_UNC_CBO_0_PERFEVTSEL1 701H | |
| MSR_UNC_CBO_0_PERFCTR0 | 706H |
| MSR_UNC_CBO_0_PERFCTR1 | 707H |
| MSR_UNC_CBO_1_PERFEVTSEL0 710H | |
| MSR_UNC_CBO_1_PERFEVTSEL1 711H | |
| MSR_UNC_CBO_1_PERFCTR0 | 716H |
| MSR_UNC_CBO_1_PERFCTR1 | 717H |
| MSR_UNC_CBO_2_PERFEVTSEL0 720H | |
| MSR_UNC_CBO_2_PERFEVTSEL1 721H | |
| MSR_UNC_CBO_2_PERFCTR0 | 726H |
| MSR_UNC_CBO_2_PERFCTR1 | 727H |
| MSR_UNC_CBO_3_PERFEVTSEL0 730H | |
| MSR_UNC_CBO_3_PERFEVTSEL1 731H | |
| MSR_UNC_CBO_3_PERFCTR0 | 736H |
| MSR_UNC_CBO_3_PERFCTR1 | 737H |
2.2 Uncore PMU Global Registers
This section details the global control and status registers.
2.2.1 MSR\_UNC\_PERF\_GLOBAL\_CTRL
The MSR_UNC_PERF_GLOBAL_CTRL register provides global control functions for all PMU resources throughout the uncore.
Table 2-2. MSR_UNC_PERF_GLOBAL_CTRL Definition
| Field Name Bit Access Description | |||
| Reserved 63:32 N/A Reserved. | |||
| FRZ_ON_PMI 31 RW Enable freezing counter when overflow. | Controls globally freezing (disables) counters on receipt of PMI request. If counters are frozen by this mechanism, software must globally re-enable counters in the interrupt service routine.0: Do not freeze counters on PMI request.1: Freeze counters on PMI request. | ||
| WAKE_ON_PMI 30 RW Enable wake on PMI. This bit determines | whether PMI event is sent to waken cores only or is broadcast to all cores after waking up any sleeping core.0: Avoid waking a core for PMI event - send event to waken cores only.1: Wake any sleeping core and send PMI event to all cores. | ||
| EN | 29 RW Enables all uncore counters. | ||
| Reserved | 28:4 | N/A | Reserved. |
| PMI_SEL_CORE3 | 3 | RW | Slice 3 select. Enables forwarding uncore PMI request to core 3. If WAKE_ON_PMI is '1' a wake request is sent to core 3 prior to sending the interrupt request.0: Take no action.1: Forward interrupt request to core 3. |
| PMI_SEL_CORE2 | 2 | RW | Slice 2 select. Enables forwarding uncore PMI request to core 2. If WAKE_ON_PMI is '1' a wake request is sent to core 2 prior to sending the interrupt request.0: Take no action.1: Forward interrupt request to core 2. |
| PMI_SEL_CORE1 | 1 | RW | Slice 1 select. Enables forwarding uncore PMI request to core 1. If WAKE_ON_PMI is '1' a wake request is sent to core 1 prior to sending the interrupt request.0: Take no action.1: Forward interrupt request to core 1. |
| PMI_SEL_CORE0 | 0 | RW | Slice 0 select. Enables forwarding uncore PMI request to core 0. If WAKE_ON_PMI is '1' a wake request is sent to core 0 prior to sending the interrupt request.0: Take no action.1: Forward interrupt request to core 0. |
2.2.2 MSR\_UNC\_PERF\_GLOBAL\_STATUS
The MSR_UNC_PERF_GLOBAL_STATUS register provides global status for all PMU resources throughout the uncore.
Table 2-3. MSR_UNC_PERF_GLOBAL_STATUS Definition
| Field Name Bit Access Description | |||
| Reserved 63:4 N/A Reserved. | |||
| CBO_CTR_OVF 31 RW1C A CBox counter overflowed (on any slice).0: No overflow detected.1: An overflow was detected on one or more counters.Writing a '0' is ignored, while writing a '1' clears this status bit. | |||
| Reserved 2 N/A Reserved. | |||
| ARB_CTR_OVF | 1 RW1C | An ARB counter overflowed.0: No overflow detected.1: An overflow was detected on one or more counters.Writing a '0' is ignored, while writing a '1' clears this status bit. | |
| FIXED_CTR_OVF | 0 RW1C | Fixed counter overflowed.0: No overflow detected.1: An overflow was detected.Writing a '0' is ignored, while writing '1' clears this status bit. | |
2.3 Fixed Counter Registers
This section details the registers of the PMU fixed counter that counts uncore clock cycles.
2.3.1 MSR\_UNC\_PERF\_FIXED\_CTRL
The MSR_UNC_PERF_FIXED_CTRL register enables the fixed counter and whether counter overflows are allowed to signal an overflow interrupt.
Table 2-4. MSR_UNC_PERF_FIXED_CTRL Definition (Sheet 1 of 2)
| Field Name | Bit | Access | Description |
| Reserved | 63:23 | N/A | Reserved. |
| CNT_EN | 22 | RW | Enable counting.0: Locally disable this counter.1: Counter is enabled and will count when global enable is set. |
Table 2-4. MSR_UNC_PERF_FIXED_CTRL Definition (Sheet 2 of 2)
| Field Name Bit Access | Description | |
| Reserved 21 N/A Reserved. | ||
| OVF_EN 20 RW Enable overflow propagation. This must be | enabled if an overflow interrupt is to be generated from this counter.0: Counter overflow is not forwarded. No PMI for this counter is possible.1: Counter overflow generates an overflow interrupt and enabled cores will be interrupted. | |
| Reserved 19:0 N/A Reserved. | ||
2.3.2 MSR\_UNC\_PERF\_FIXED\_CTR
MSR_UNC_PERF_FIXED_CTR is a 48 bit fixed counter that increments on uncore clock cycles.
Table 2-5. MSR_UNC_PERF_FIXED_CTR Definition
| Field Name Bit Access | Description | ||
| Reserved 63:48 | N/A Reserved. | ||
| CTR_VAL 47:0 | RW Current count of the number of elapsed UCLK cycles. | ||
2.4 Uncore CBo and ARB PMU Registers
This section details the registers available for performance monitoring control and counting for each counter in each CBo and the ARB.
2.4.1 MSR\_UNC\_CBO\_CONFIG
The MSR_UNC_CBO_CONFIG register is read only and reports the number of CBo slices available on the platform. This information is used to determine how many CBo units need to be configured for performance monitoring. Programmers should read this register and subtract one to determine the number of CBo units available for performance monitoring.
Table 2-6. MSR_UNC_CBO_CONFIG Definition
| Field Name Bit | Access | Description | |
| Reserved 63:4 N/A Reserved. | |||
| NO_CBO_BANKS | 3:0 | RO | Specifies the number of C-Box units with programmable counters (including processor cores and processor graphics). |
2.4.2 Performance Event Select Registers
The event select registers configure which event will be counted and how.
There are up to four CBo units, each with four event select control registers, for a total of sixteen possible registers. There is a single ARB unit with two event select control registers.
The performance event select registers are iterated below and share the same definition.
MSR_UNC_CBO_0_PERFEVTSEL0
MSR_UNC_CBO_0_PERFEVTSEL1
MSR_UNC_CBO_1_PERFEVTSEL0
MSR_UNC_CBO_1_PERFEVTSEL1
MSR_UNC_CBO_2_PERFEVTSEL0
MSR_UNC_CBO_2_PERFEVTSEL1
MSR_UNC_CBO_3_PERFEVTSEL0
MSR_UNC_CBO_3_PERFEVTSEL1
MSR_UNC_ARB_PERFEVTSEL0
MSR_UNC_ARB_PERFEVTSEL1
Table 2-7. MSR_UNC_CBO_0_PERFEVTSEL0 Definition (Sheet 1 of 2)
| Field Name Bit Access Description | |||
| Reserved 63:29 N/A Reserved. | |||
| THR 28:24 RW This field is compared directly against the | event increment and may cause the counter to increment by one based on the programming of the INV bit.When this field is zero, threshold comparison is disabled and the event is passed without modification (i.e. the counter will advance by the event increment value). | ||
| INV 23 RW This bit indicates how the threshold field will | be compared to the incoming event.0: The counter will increment by one if the event increment in the current cycle is greater than or equal to the value programmed in the threshold field.1: The counter will increment by one if the event increment in the current cycle is less than the value programmed in the threshold field. | ||
| EN 22 RW Locally enable the associated counter. | 0: Counter is locally disabled.1: Counter is locally enabled. | ||
| Reserved 21 N/A Reserved. | |||
| OVF_EN | 20 RW Enable transmission of overflow indication,necessary if this counter is to generate a PMI and interrupt the cores.0: Disable transmission of overflow indication. No PMI for this counter will be generated.1: Enable transmission of overflow indication.May generate a PMI request to the cores. | ||
| Reserved 19 N/A Reserved. | |||
Table 2-7. MSR_UNC_CBO_0_PERFEVTSEL0 Definition (Sheet 2 of 2)
| Field Name Bit Access | Description | ||
| E 18 RW Enable counting on event edge (increment) | signal transitions from de-asserted to asserted) or level. Counting edges provides the number of occurrences of an event, while level counting provides the cycles an event was active.0: Count the cycles the programmed event was active.1: Count the occurrences of the programmed event. | ||
| Reserved 17:16 N/A Reserved. | |||
| UMASK 15:8 RW This field must be programmed with the | proper unit mask. Bits set in this field enable sub-events of the encoded event in EVT_SEL. | ||
| EVT_SEL 7:0 RW This field must be programmed with the | desired event encoding. | ||
2.4.3 Performance Counter Registers
There is a matching performance counter for each performance event select register in the CBo units and ARB unit. The performance counter registers are a 44 bit counter where event counts are accumulated. Reading the register will tell users how many times the event programmed has been counted.
The performance counter registers are iterated below and share the same definition.
MSR_UNC_CBO_0_PERFCTR0
MSR_UNC_CBO_0_PERFCTR1
MSR_UNC_CBO_1_PERFCTR0
MSR_UNC_CBO_1_PERFCTR1
MSR_UNC_CBO_2_PERFCTR0
MSR_UNC_CBO_2_PERFCTR1
MSR_UNC_CBO_3_PERFCTR0
MSR_UNC_CBO_3_PERFCTR1
MSR_UNC_ARB_PERFCTR0
MSR_UNC_ARB_PERFCTR1
These registers share the definition below.
Table 2-8. MSR_UNC_CBO_0_PERFCTR0 Definition
| Field Name Bit | Access | Description |
| Reserved 63:44 N/A Reserved. | ||
| CTR_VAL | 43:0 RW The value of | the programmable counter. |
3 6th Generation Intel ^® Processor Uncore Performance Monitoring Events
This section details the specific uncore performance monitoring events that are available for the CBo and ARB. or each event there is an even name, event ID, umask and description. The code is the value that is to be written to the EVT_SEL field in the appropriate control register and the umask is to be written to the UMASK field in the appropriate control register. The event tables also contain information on if a specific event has counter restrictions.
3.1 CBo Uncore PerfMon Events
For all CBo counters, it is recommended to work with the sum of the counter values from all CBos.
The following table details the available events from the CBo units.
Table 3-1. Uncore PMU MSR List (Sheet 1 of 2)
| Event Name | Event ID | Umask | Description | Valid Counters |
| UNC_CBO_XSNP_RESPONSE.MISS_XCORE 0x22 | 0x41 A | cross-core | snoop initiated by this CBo due to processor core memory request which misses in some processor core. | 0, 1 |
| UNC_CBO_XSNP_RESPONSE.MISS_EVICTION 0x22 | 0x81 | A cross-core | snoop resulted from LLC Eviction which misses in some processor core. | 0, 1 |
| UNC_CBO_XSNP_RESPONSE.HIT_XCORE | 0x22 | 0x44 | A cross-core snoop initiated by this CBo due to processor core memory request which hits a non-modified line in some processor core. | 0, 1 |
| UNC_CBO_XSNP_RESPONSE.HITM_XCORE 0x22 | 0x48 A | cross-core | snoop initiated by this CBo due to processor core memory request which hits a modified line in some processor core. | 0, 1 |
| UNC_CBO_CACHE_LOOKUP.WRITE_M 0x34 0x21 | LLC lookup | up write | request that accesses cache and found line in M-state. | 0, 1 |
| UNC_CBO_CACHE_LOOKUP.ANY_M 0x34 0x81 | LLC lookup | any request | that accesses cache and found line in M-state. | 0, 1 |
| UNC_CBO_CACHE_LOOKUP.READ_I 0x34 0x18 | LLC lookup | read request | that accesses cache and found line in I-state. | 0, 1 |
| UNC_CBO_CACHE_LOOKUP.ANY_I 0x34 0x88 | LLC lookup | any request | that accesses cache and found line in I-state. | 0, 1 |
Table 3-1. Uncore PMU MSR List (Sheet 2 of 2)
| Event Name | Event ID | Umask | Description | Valid Counters |
| UNC_CBO_CACHE_LOOKUP.READ_MESI 0x34 0x | 1F LLC lookup read | request that accesses cache and found line in any MESI-state. | 0, 1 | |
| UNC_CBO_CACHE_LOOKUP.WRITE_MESI 0x34 | 0x2F LLC | lookup write | request that accesses cache and found line in MESI-state. | 0, 1 |
| UNC_CBO_CACHE_LOOKUP.ANY_MESI 0x34 0x8 | F LLC lookup any request | request that accesses cache and found line in MESI-state. | 0, 1 | |
| UNC_CBO_CACHE_LOOKUP.ANY_ES 0x34 0x86 | LLC lookup any request | request that accesses cache and found line in E or S-state. | 0, 1 | |
| UNC_CBO_CACHE_LOOKUP.READ_ES 0x34 0x16 | LLC lookup read request | request that accesses cache and found line in E or S-state. | 0, 1 | |
| UNC_CBO_CACHE_LOOKUP.WRITE_ES 0x34 0x26 | LLC lookup write | request that accesses cache and found line in E or S-state. | 0, 1 | |
3.2 ARB Uncore PerfMon Events
The following table details the available events from the ARB unit.
Table 3-2. ARB PerfMon Events
| Event Name | Event ID | Umask | Description | Valid Counters |
| UNC_ARB_TRK_OCCUPANCY.ALL | 0x80 0x01 Count cycles of outgoing, valid entries from cores. | 0 | ||
| UNC_ARB_TRK_REQUESTS.ALL | 0x81 0x01 Total number of core outgoing entries allocated. Accounts for coherent and non-coherent traffic. | 0, 1 | ||
| UNC_ARB_TRK_REQUESTS.WRITES | 0x81 0x20 Number of writes allocated including any write transaction including full, partials and evictions. | 0, 1 | ||
| UNC_ARB_COH_TRK_REQUESTS.ALL | 0x84 0x01 Number of entries allocated for any type. | 0, 1 | ||
| UNC_ARB_TRK_OCCUPANCY.CYCLES_WITH_ANY_REQUEST | 0x80 0x01 Cycles with at least one request outstanding, waiting for data to return from memory controller. Accounts for coherent and non-coherent requests initiated by IA cores, processor graphics unit, or LLC. | 0 | ||
| UNC_CLOCK.SOCKET | 0x00 0x01 This 48-bit fixed counter counts the UCLK cycles. | Fixed | ||
3.3 IMC Events
The integrated memory controller unit of the 6th Generation Intel® Processor contains five model specific, fixed counters that allow for monitoring the number of requests to DRAM.
The fixed counters residing in the memory controller monitor transaction requests coming from various sources, e.g. the processor cores, the graphic engine, or other I/O agents. Unlike the MSR based performance counter registers in the CBo and ARB, the IMC fixed counter interface uses memory-mapped I/O reads from physical memory at the offsets specified in the IMC event table.
This set of counters are free-running and always-running. Software can read the value, wait for a desired internal, read again, then subtract the first sample from the second to determine how many times the event incremented in the sample interval.
The IMC counters below are model specific, meaning they may change or not be supported in the future.
To obtain the BAR address, read the value (in PCI configuration space) at Bus 0; Device 0; Function 0; Offset 48H and mask with the value 0x0007FFFFFF8000.
Table 3-3. IMC Counters
| Name Address | Description | |
| DRAM_GT_REQUESTS BAR | + 0x5040 Counts | every read/write request entering the Memory Controller to DRAM (sum of all channels) from the GT engine. Each partial write request counts as a request incrementing this counter. However same-cache-line partial write requests are combined to a single 64-byte data transfers from DRAM. Therefore multiplying the number of requests by 64-bytes will lead to inaccurate GT memory bandwidth. The inaccuracy is proportional to the number of same-cache-line partial writes combined. |
| DRAM_IA_REQUESTS BAR | + 0x5044 Counts | every read/write request (demand and HW prefetch) entering the Memory Controller to DRAM (sum of all channels) from IA. Each partial write request counts as a request incrementing this counter. However same-cache-line partial write requests are combined to a single 64-byte data transfers from DRAM. Therefore multiplying the number of requests by 64-bytes will lead to inaccurate IA memory bandwidth. The inaccuracy is proportional to the number of same-cache-line partial writes combined. |
| DRAM_IO_REQUESTS | BAR+ 0x5048 | Counts every read/write request entering the Memory Controller to DRAM (sum of all channels) from all IO sources (e.g. PCIe, Display Engine, USB audio, etc.). Each partial write request counts as a request incrementing this counter. However same-cache-line partial write requests are combined to a single 64-byte data transfers from DRAM. Therefore multiplying the number of requests by 64-bytes will lead to inaccurate IO memory bandwidth. The inaccuracy is proportional to the number of same-cache-line partial writes combined. |
| DRAM_DATA_READS | BAR+ 0x5050 | Counts every read (RdCAS) issued by the Memory Controller to DRAM (sum of all channels). All requests result in 64-byte data transfers from DRAM. Use for accurate memory bandwidth calculations. |
| DRAM_DATA_WRITES | BAR+ 0x5054 | Counts every write (WrCAS) issued by the Memory Controller to DRAM (sum of all channels). All requests result in 64-byte data transfers from DRAM. Use for accurate memory bandwidth calculations. |
4 Terminology
List of terms used in this document found below.
Table 4-1. List of Terms
| Term Definition | |
| ARB Refers to the arbitration unit. | |
| Clear In reference to register programming, this means a bit is programmed to binary zero (0). | |
| CBo Refers to the cache box unit or Cbox unit | |
| IA Intel Architecture. | |
| LLC Last-level cache. The lowest level of cache, after which memory requests must be satisfied by system memory. This is the longest latency cache. | |
| MESI MESI refers to the cache coherency protocol where a cache-line state is represented as M for modified, E for exclusive, S for shared and I for invalid. | |
| MSR Model Specific Register. PMU counter and counter control registers are implemented as MSR registers. They are accessed via the rdmsr and wrmsr instruction. Certain counter registers can be accessed via the rdpmc instruction. | |
| PEBS Precise Event Based Sampling. A special counting mode in which counters can be configured to overflow, interrupt the processor, and capture machine state at that point. | |
| PerfMon Short for Performance Monitoring. | |
| PMI Performance Monitoring Interrupt. This interrupt is generated when a counter overflows and has been programmed to generate an interrupt, or when the PEBS buffer interrupt threshold has been reached. The interrupt vector for this interrupt is controlled through the Local Vector Table in the Local APIC. | |
| PMU | Performance Monitoring Unit. |
| RO | Read only, indicating that a specific field in a register can be read but not written to. |
| RW | Read and write, indicating that a specific field in a register can be both written to and read from. |
| RW1C | Indicates that a specific field in a register can be both written to and read from and that writing a 1 will clear the register. |
| Set | In reference to register programming, this means a bit is programmed to binary one (1). |
| SMT | Simultaneous Multi-threading. |
| Thread | A hardware thread of execution. In other words, Intel® Hyper-Threading Technology (Intel® HT Technology). |
| Uop Micro-operation. Macro instructions are broken down into micro-operations within the machine, and these 'uops' are executed by the execution units. | |
| UNC | Uncore |
- 6th Generation Intel® Core™ Processor Family Uncore Performance Monitoring Reference Manual
- Contents
- Introduction....5
- Uncore Performance Monitoring Facilities....9
- 6th Generation Intel® Processor Uncore Performance Monitoring Events ......15
- Terminology....19
- Figures
- Tables
- Introduction
- Uncore PMU Overview
- Changes from 5th Generation Intel ® Core TM Processor to 6th Generation Intel ® Core TM Processor
- MSR Addresses
- Uncore PMU Counter Summary
- Uncore Performance Monitoring Facilities
- Uncore PMU MSR Listing
- Uncore PMU Global Registers
- MSR\_UNC\_PERF\_GLOBAL\_CTRL
- MSR\_UNC\_PERF\_GLOBAL\_STATUS
- Fixed Counter Registers
- MSR\_UNC\_PERF\_FIXED\_CTRL
- MSR\_UNC\_PERF\_FIXED\_CTR
- Uncore CBo and ARB PMU Registers
- MSR\_UNC\_CBO\_CONFIG
- Performance Event Select Registers
- Performance Counter Registers
- 6th Generation Intel ® Processor Uncore Performance Monitoring Events
- CBo Uncore PerfMon Events
- ARB Uncore PerfMon Events
- IMC Events
- Terminology
Brand : INTEL
Model : Core i5-6400
Category : Processor