
42265 - Thermometer Extech - Free user manual and instructions
Find the device manual for free 42265 Extech in PDF.


| Product Type | Digital Thermometer |
| Manufacturer | Extech Instruments |
| Model | 42265 |
| Measurement Type | Type K/J Thermocouple |
| Temperature Range (Type K) | -200°C to 1372°C (-328°F to 2501°F) |
| Temperature Range (Type J) | -200°C to 1000°C (-328°F to 1832°F) |
| Accuracy | ±0.1% of reading ±0.6°C (1.1°F) |
| Resolution | 0.1°C/0.1°F up to 999.9°, then 1°C/1°F |
| Input Channels | Dual (T1, T2, T1-T2) |
| Display | Large backlit LCD |
| Data Hold | Yes |
| Min/Max/Average | Yes |
| Auto Power Off | Yes (adjustable) |
| Battery Type | 9V battery (1 supplied) |
| Battery Life | Approximately 100 hours |
| Dimensions | 7.8 x 5.4 x 2.0 in (198 x 137 x 50 mm) |
| Weight | 15.5 oz (440 g) |
| Included Accessories | Battery, dual Type K beaded wire probes, carrying case, manual |
| Certification | CE, RoHS |
Frequently Asked Questions - 42265 Extech
User questions about 42265 Extech
0 question about this device. Answer the ones you know or ask your own.
Ask a new question about this device
Download the instructions for your Thermometer in PDF format for free! Find your manual 42265 - Extech and take your electronic device back in hand. On this page are published all the documents necessary for the use of your device. 42265 by Extech.
USER MANUAL 42265 Extech
Model 42275 Temperature and Humidity Datalogger Kit
Model SW276 Datalogging Software
Introduction
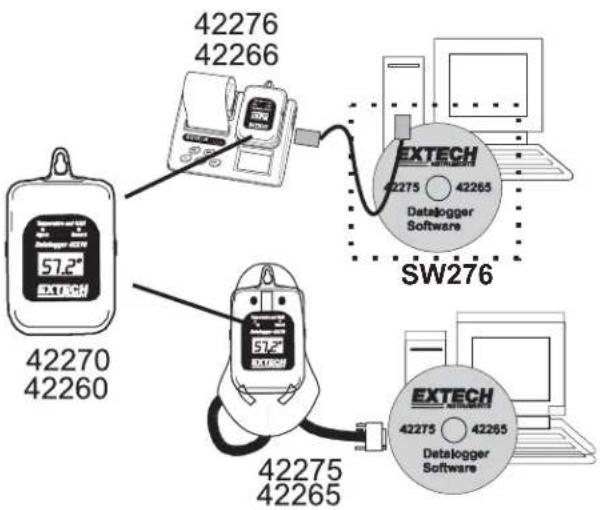
Congratulations on your purchase of Extech Instrument's Datalogging instrumentation and software. This User Guide serves three purposes, refer to the list below:
- This User Guide covers the following products entirely with regard to hardware and software operation:
Model 42275: Temperature and Humidity Datalogging Module with docking station and SW276 Windows™ Software
Model 42265: Temperature Datalogging Module with docking station & SW276 Windows™ Software
Model SW276: Windows™ Datalogging Software
- This User Guide covers the following products with regard to software and some hardware operation. A separate manual is supplied with your instrument that covers all of the hardware operation.
Model 42276: Temperature & Humidity Datalogging Module plus printing/docking station & Optional SW276 Windows™ Software
Model 42266: Temperature-only Datalogging Module plus printing/docking station & Optional SW276 Windows™ Software
Model 42270: Temperature and Humidity Datalogging Module
Model 42260: Temperature-only Datalogging Module
- This User Guide covers the following products with regard to software only; all other information regarding hardware is covered in a separate, dedicated manual supplied with the instrument.
Model 42280: Temperature and Humidity Datalogger (Software instructions only)
Applications
The Datalogging modules models 42270 and 42260 can be used to monitor the temperature of greenhouses, warehouses, food transports, aircraft cabins, refrigerated trucks, containers, museums, and HVAC equipment. The Model 42270 records Relative Humidity readings in addition to temperature readings. Modules can store 16,000 (8000 temperature and 8000 %RH for 42270) readings that can later be transferred to PC or directly printed using the Model 42276 Programmer/Printer.
The datalogger module display will not switch on until activated through the software
The datalogger module display will not switch on until it is activated by the software in the LOGGER SET menu as described later in this manual. In LOGGER SET the user selects the type of recording activation. When the logger begins to log data, the display and status LEDs will switch on.
Important note on the Model 42280 Temperature/Humidity Datalogger
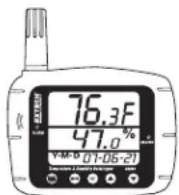
Note that the Model 42280 has its own User Guide. Please refer to the separate User Guide supplied with the Model 42280 for details on the meter's operation. This manual covers only the Datalogging software with regard to the 42280. Install the supplied Software as described on the program CD's label and then skip to page 5 of this manual for software instructions.
Model 42280
V7.1 1/08
Description
- LCD display
- Mounting hole
- Docking station
- Interface Cable
- Status LEDs
- Software CD

Displays
LCD Display
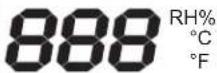
REC: Displayed while logging readings. Read the 'Recording Status' section for further details.
HI and LOW: Displayed when the High or Low Alarm limit is exceeded. See 'Alarm Status' below for further information.
RH%: Relative Humidity (42270 and 42275 only)
C or F: Temperature units.
COMM: Appears when Datalogger is communicating with a PC.
REC HI LOW COMM
Recording Status Indication
Both the RED status LED and the display indicator 'REC' will flash every 5 seconds if the sampling rate is set to 5 seconds or higher. If the sampling rate is set lower than 5 seconds, the indicators will flash every 1, 2, 3, or 4 seconds as programmed.
ALARM Status Indication
Both the YELLOW status LED and the display indicator 'ALM' will flash when the recorded value is higher than the user programmed High Alarm value or lower than the Low Alarm value. The Alarm status LED and the 'ALM' display indicator flash every 5 seconds if the sampling rate is programmed for 5 seconds or higher. If the sampling rate is set lower than 5 seconds, the indicators will flash every 1, 2, 3, or 4 seconds as programmed.
Low Battery Indication
When the lithium battery's voltage nears the critical operating level the LCD displays 'LO'. To replace the battery, refer to the Battery Replacement section of this manual.
Installation instructions for models 42266 and 42276
Note: The software program and USB driver must both be installed in order for the printer/meter to communicate with the software. Please follow the installation instructions below.

- Place the supplied software CD in the PC CD-ROM. The Data Acquisition Setup Menu will appear (see below).
- Click on "Install Software" to start the installation of the software.
- Click "Finish" to install the program to the default location or click on "Change" to enter the directory in which to install the program.
- Follow the on-screen instructions to complete the program installation.
- Click "Install USB" and follow the on screen instructions to complete the USB driver installation.
LNK PC Link Screen
The printer must be set to PC communication on the Link screen before communication can occur.
- Turn the printer on
- Press the Menu button until the LNK screen appears.
- Press the Up or Down button to select the logger or the printer memory.
- Press Enter when the selection is complete

Installation Instructions for models 42265 and 42275
Place the supplied software CD in the PC CD-ROM drive.
- Click on "Install Software" to start the installation of the software.
- Click "Finish" to install the program to the default location or click on "Change" to enter the directory in which to install the program.
- Follow the on-screen instructions to complete the program installation.

Setup menu description
- Install USB driver
- Exit: Close the Setup Menu
- Software Version number
- Software installation
- Open the English manual
- Open the Spanish manual
- Visit the Extech website
- View all items on the CD-ROM

Main Screen

Diagram A: Main Screen
Cursor 1 and 2 Control
Click on a cursor line to select it. When the red cursor line is clicked, it turns bold red. When you click the green cursor, it turns bold green (colors may vary). The CURSOR STATUS field (lower left) shows the cursor positions. As the Arrow keys are used to select the last record or the next record, the cursor location numbers change to reflect their new position.
Left arrow key: Moves to previous point on the current plot.
Right arrow key: Moves to next point on the current plot.
The user can also click and drag the cursor with the mouse. The cursor tracks the mouse until the mouse button is released. When the mouse button is released, the cursor snaps to the nearest data point.
Offset Knob
Use the Offset control in the DISPLAY CONTROL field (lower right) to optimize the data viewing area. Press the up or down arrow key to increment or decrement the record number (with corresponding date) in the graph.
Zoom and Pan on Graphs
To zoom in, press the
To pan, press the
To restore the view to its original state (after zooming or panning), press and hold the left mouse button and drag the line on the Offset or Range knob (located in the DISPLAY CONTROLS section).
Horizontal Axis select switch
Use the mouse to control the switch and select Record number or Time (HH:MM:SS) label for the horizontal axis of the graph.

Warning message
A warning message will appear on the lower left if the Datalogger is disconnected from the PC.
<< WARNING: Data Logger not plugged into interface module! >>
Display Control
After downloading or retrieving a record, the numbers on the "Offset" and "Range" knobs will change to:
Offset: 0000/5000/10000/15000
Range: 50/250/500/1K/2K/4K/8K/12K/16K
Save File
To save a transferred data file
Click on SAVE FILE, select a folder, and name the data file.

Retrieve File
Click on RETRIEVE FILE to retrieve a previously saved file.

To aid in reading a graph, a grid can be drawn on the graph. A dialogue box at the bottom left hand corner shows the grid (CONTROL LOCATION Cursor 1 and 2)
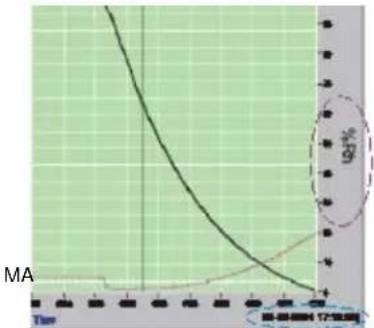
After retrieving a file containing Humidity records, the labels "Temperature" and "Humidity" will appear at the beginning of the curves. If no Humidity data is transferred, only the Temperature curve will appear.

line
| Demand (kW) | Rate (%) | |-------------|----------| | Low | 0 | | High | 100 |The date and time of the first point appears on the left hand corner. The last point's date and time appears on the right hand corner.
line
| Time | Value | |------|-------| | 0 | -1% | | 6 | -3% | | 12 | -5% |Com Port Setup
Select "Com. Set". Select the COM port, Baud rate (9600), Data bits (8), Parity (None) and Stop bits (1).
Select OK to accept settings, press Cancel to abort and exit.

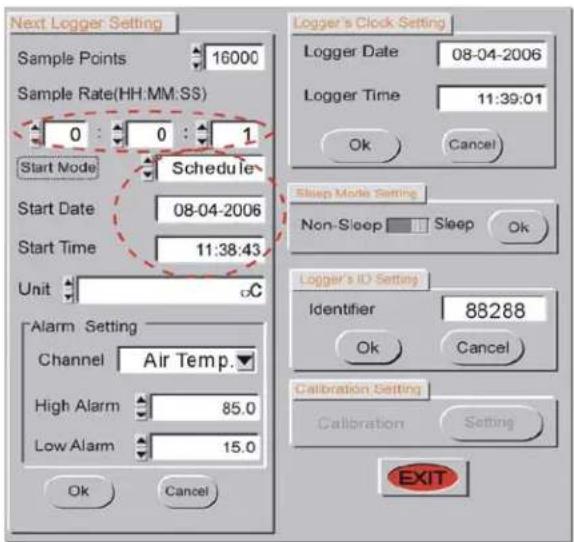
Datalogger Settings
Press LOGGER to access the menu page
Sample Rate Setup
Number of Data Points
Select the desired number of data samples to log: 1000 / 2000 / 4000 / 8000 / 12000 / 16000. Scroll up or down to located the value and then click OK to save. For example, to select 1,000 samples, the logger will stop logging (and will power off) when 1000 data points have been collected. Datalogging ceases when the datalogger is full. The yellow LED will stop flashing when datalogging ceases.
Sample Rate
Select the sampling rate in seconds (1 second to 12 hours). Scroll up to increase the time or down to decrease the time in seconds. The defaults sample rate is 2 seconds.
Start Modes
Scheduled Start
Scheduled Start sets the desired datalogging Start Date and Start Time. The datalogger will start when the clock reaches the user programmed time and date. Ensure that the datalogger is set to the current date and time.
Magnetic Start
Connect the datalogger to the PC to begin configuring the Magnetic start mode. Select Magnetic and ensure that the datalogger is set to the current date and time. Enter the desired ID (if any) and then press "OK" to confirm the Magnetic start setting. To start datalogging in Magnetic mode, pass a strongly magnetized object by the bottom of the datalogger. The LED will start flashing. Flashing rate depends on the sampling rate programmed.
Immediate Start
The datalogger starts recording when the "OK" button is pressed.
Start Mode Setup

Datalogger Clock Setting
Click OK to set logger to PC system time.
Alarm Setting
The default High Alarm temperature is 85 C
The default Low Alarm temperature is -40 C
The default High Alarm for Relative Humidity is 100%
The default Low Alarm Relative Humidity is 0%
Select the desired High value or Low value by scrolling up or down.

The ALM LED flashes:
a. If the measured Temperature is higher than the HI Alarm setting or lower than the LO Alarm setting.
b. Every second while the data is transferring to the PC. c. Once every datalogging interval. For example, if the sampling rate is set to 3 seconds, the ALM LED will flash every 3 seconds.
Unit Setting

Temperature can be displayed in "C" or "F"
Data Logger ID Setting
The datalogger's ID
setting allows the user to provide a unique name for each datalogger (up to 8-digits).

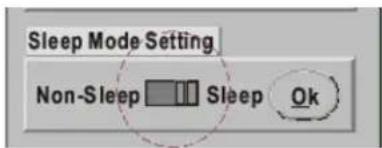
Sleep Mode Setting
In Sleep Mode the Datalogger turns the display off after Datalogging has been completed. Select the Sleep Mode in software by moving the slide switch to the right for SLEEP then click OK.
If NON-SLEEP is selected, the logger will continually display the current Temperature / Relative Humidity. (The default is Non-Sleep)
Data Table
Press the DATA TABLE icon to view data

GO Process the data using the conditions selected.
Channel Selects Temperature or Humidity for analysis.
Condition Selects if range values are "AND" (both occur) or "OR" (either occurs).
Error Selects and counts all the error codes in the file.
Usage Indicates the number of records that exceeded the limit condition selected.
Counter Indicates the number of times a record or group of records exceeds the limit condition selected.
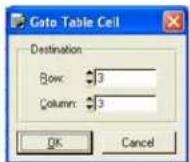
Goto
Right click in any cell to launch the "Go-to Table Cell" menu. Enter the row and column of the cell to locate.
Find
Right click in any cell to launch the "Find in Table Cells" menu. Enter search data and check the condition boxes as needed.

Statistics
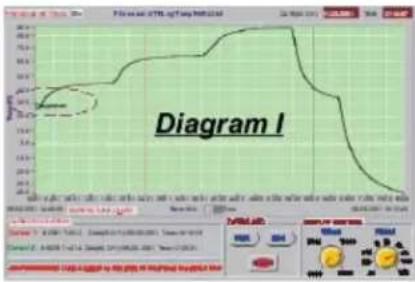
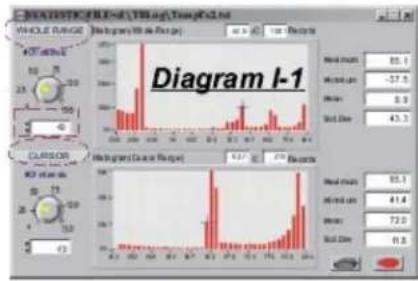
Press the STATISTICS icon to view histograms of data based on the "Whole Range" or the "Cursor Range". See (Diagram I)
Whole Range - All of the logged readings.
Cursor Range - Only the readings between the two cursors.
-
Click and drag the knobs' yellow line (shown in the left side of Diagram I-1) to equally divide all sample readings into 4 divisions (up to 130). This can also be done by clicking on the UP/DOWN arrows or by keying in the value directly.
-
Refer to the top of Diagram I-1, notice that there are 1021 logged readings at 44°C. There are also 213 readings between the two cursors at 62.7°C
-
If all of the logged readings are placed into 100 divisions, the histogram for the Whole Range will reflect the change.
line
| Time (min) | Value | |------------|-------| | 0 | 0 | | 1 | 20 | | 2 | 40 | | 3 | 60 | | 4 | 70 | | 5 | 75 | | 6 | 78 | | 7 | 79 | | 8 | 78 | | 9 | 75 | | 10 | 70 | | 11 | 60 | | 12 | 40 | | 13 | 20 | | 14 | 0 |
bar
| Sample | Value | |--------|-------| | 85.1 | -27.5 | | 81.4 | 73.0 | | 85.1 | -43.3 |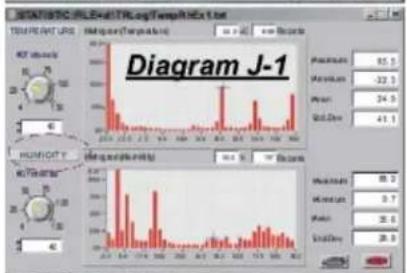
bar
| Metric | Value | |--------|-------| | Maximum | 85.5 | | Median | -32.3 | | Low | 24.9 | | QoL Diver | 41.1 |
line
| Parameter | Value | | --------- | ----- | | MD (Time) | 37.5 | | V (dB) | 9.9 | | Set(Dem) | 43.3 | | MD (arct) | 82.1 | | V (arct) | 41.4 | | Set(Dem) | 72.0 | | Set(Dem) | 11.0 |
line
| Metric | Value | |--------|-------| | Maximum | 55.5 | | Minima | -22.5 | | Mean | 24.5 | | Std Dev | 41.1 | | Final Value | 58.2 | | Final Value | 9.7 | | Mean | 36.8 | | Std Dev | 28.5 |- Diagram 1-2 is another example of setting the cursor range; it has been set to 100 divisions.
- Diagram J-1 shows that cursor 1 is used for the temperature readings and the lower region shows the Relative Humidity records. In Diagram J-2 the divisions are set to 130.
- Diagram I is a Temperature example using Diagrams I-1 and I-2 as data sources. Diagram J is a Temperature and Humidity example using Diagrams J-1 and J-2 as data sources.
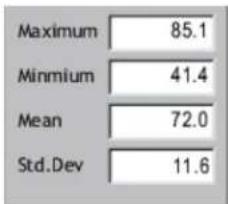
- The right side of Diagram I indicates Maximum, Minimum, Mean and Standard Deviation (Std. Dev) values for Whole Range (upper part) and Cursor Range (lower part).
other
| Category | Value | |---|---| | Maximum | 85.1 | | Minmium | 41.4 | | Mean | 72.0 | | Std.Dev | 11.6 |Maximum: The highest reading in Whole Range or Cursor Range.
Minimum: The lowest reading.
Mean: The Average reading.
Std. Dev.: A calculation of the deviation between each reading and the Mean value (See Diagram I-1).
Print Graph
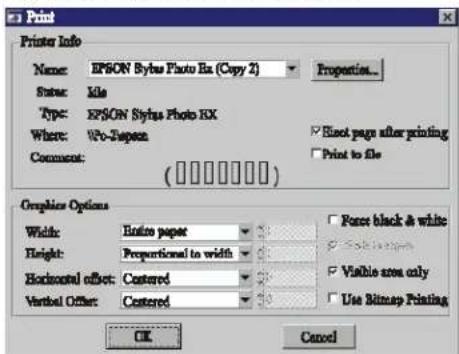
Press the PRINT icon to print the graph.
Group Files
Click GROUP FILES to view the "Multi-Logger Monitor" designed to view and compare data files. Diagram M shows the screen as it appears before the icon is clicked. Select the color of the curve by clicking the color block. Print the data by clicking the printer icon at the right-most top corner.
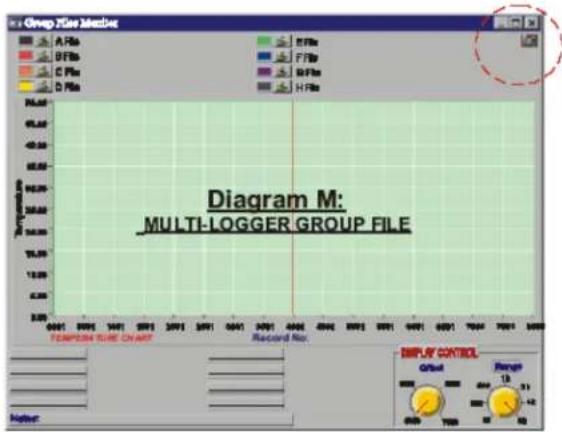
Note: To retrieve a file to replace the current file shown on the graph:
a. Select the file to replace
b. Choose transparent from the color selections (graph disappears)
c. Select the file to retrieve
Click 📄 to select the file that will be used for comparison, click the color icon box to select the desired color. Each file is represented by a capital letter (A through H) with the file name following the letter.

line
| Time (min) | Temperature (°C) | |------------|------------------| | 0 | -6.0 | | 10 | -4.0 | | 20 | -3.0 | | 30 | -2.0 | | 40 | -1.0 | | 50 | 0.0 | | 60 | 1.0 | | 70 | 2.0 | | 80 | 3.0 | | 90 | 4.0 | | 100 | 5.0 | | 110 | 6.0 | | 120 | 7.0 | | 130 | 8.0 | | 140 | 9.0 | | 150 | 10.0 | | 160 | 11.0 | | 170 | 12.0 | | 180 | 13.0 | | 190 | 14.0 | | 200 | 15.0 | | 210 | 16.0 | | 220 | 17.0 | | 230 | 18.0 | | 240 | 19.0 | | 250 | 20.0 | | 260 | 21.0 | | 270 | 22.0 | | 280 | 23.0 | | 290 | 24.0 | | 300 | 25.0 | | 310 | 26.0 | | 320 | 27.0 | | 330 | 28.0 | | 340 | 29.0 | | 350 | 30.0 | | 360 | 31.0 | | 370 | 32.0 | | 380 | 33.0 | | 390 | 34.0 | | 400 | 35.0 | | 410 | 36.0 | | 420 | 37.0 | | 430 | 38.0 | | 440 | 39.0 | | 450 | 40.0 | | 460 | 41.0 | | 470 | 42.0 | | 480 | 43.0 | | 490 | 44.0 | | 500 | 45.0 | | 510 | 46.0 | | 520 | 47.0 | | 530 | 48.0 | | 540 | 49.0 | | 550 | 50.0 | | 560 | 51.0 | | 570 | 52.0 | | 580 | 53.0 | | 590 | 54.0 | | 600 | 55.0 | | 610 | 56.0 | | 620 | 57.0 | | 630 | 58.0 | | 640 | 59.0 | | 650 | 60.0 | | 660 | 61.0 | | 670 | 62.0 | | 680 | 63.0 | | 690 | 64.0 | | 700 | 65.0 | | 710 | 66.0 | | 720 | 67.0 | | 730 | 68.0 | | 740 | 69.0 | | 750 | 70.0 | | 760 | 71.0 | | 770 | 72.0 | | 780 | 73.0 | | 790 | 74.0 | | 800 | 75.0 | | Note: The 'Temperature' data is not explicitly labeled in the code provided in the chart title, so it is not included in the original data table.When comparing data files:
Diagram M shows the main screen before a file is retrieved.
Diagram N shows the main screen with an example file loaded. The offset and range settings can be changed by moving the indicator on the yellow rotating knob (refer to Diagram O).
Temperature Chart
The Temperature Chart displays the data after all readings are completely downloaded.
Cursor Status
The Cursor Status indicates the exact positions of Cursor 1 and 2.

nDiagram Q
Previous Setting
Previous setting records are listed in this column for reference.

To download data from another datalogger without exiting the current screen:
a) Click "PREVIOUS SETTING" to replace the last logger data with a new one.
b) Close and reopen the program.
Note: Clicking on "Retrieve File" will not download from a new datalogger; Follow the above instructions.
Message
The message area is blank if no file has been retrieved. After a file is retrieved the message will display as follows:
"Retrieve file completed"
Download Commands
Start - To begin downloading data (See below diagram)
Stop - To manually stop downloading data.
Exit - To exit the Download utility.

Display Control
Offset - Allows the user to select a point in the reading log to begin viewing the data. See the examples below.

Example 1: Set the Offset by clicking and dragging the red indicator to "0000" (Diagram R-1). The screen shows 0001 as the starting point for the 8,000 record total.

line
| Date | Temperature (°C) | | ---------- | ---------------- | | 2008-06-29 | 7.5 | | 2008-07-01 | 7.4 | | 2008-07-02 | 7.3 | | 2008-07-03 | 7.2 | | 2008-07-04 | 7.1 | | 2008-07-05 | 7.0 | | 2008-07-06 | 6.9 | | 2008-07-07 | 6.8 | | 2008-07-08 | 6.7 | | 2008-07-09 | 6.6 | | 2008-07-10 | 6.5 | | 2008-07-11 | 6.4 | | 2008-07-12 | 6.3 | | 2008-07-13 | 6.2 | | 2008-07-14 | 6.1 | | 2008-07-15 | 6.0 | | 2008-07-16 | 5.9 | | 2008-07-17 | 5.8 | | 2008-07-18 | 5.7 | | 2008-07-19 | 5.6 | | 2008-07-20 | 5.5 | | 2008-07-21 | 5.4 | | 2008-07-22 | 5.3 | | 2008-07-23 | 5.2 | | 2008-07-24 | 5.1 | | 2008-07-25 | 5.0 | | 2008-07-26 | 4.9 | | 2008-07-27 | 4.8 | | 2008-07-28 | 4.7 | | 2008-07-29 | 4.6 | | 2008-07-30 | 4.5 | | 2011-11-31 | 4.4 | | 2011-12-31 | 4.3 | | 2011-12-31 | 4.2 | | 2011-12-31 | 4.1 | | 2011-12-31 | 4.0 | | 2011-12-31 | 3.9 | | 2011-12-31 | 3.8 | | 2011-12-31 | 3.7 | | 2011-12-31 | 3.6 | | 2011-12-31 | 3.5 | | 2011-12-31 | 3.4 | | 2011-12-31 | 3.3 | | 2011-12-31 | 3.2 | | 2011-12-31 | 3.1 | | 2011-12-31 | 3.0 | | 2011-12-31 | 2.9 | | 2011-12-31 | 2.8 | | 2011-12-31 | 2.7 | | 2011-12-31 | 2.6 | | 2011-12-31 | 2.5 | | 2011-12-31 | 2.4 | | 2011-12-31 | 2.3 | | 2011-12-31 | 2.2 | | 2011-12-31 | 2.1 | | 2011-12-31 | 2.0 | | 2011-12-31 | 1.9 | | 2011-12-31 | 1.8 | | 2011-12-31 | 1.7 | | 2011-12-31 | 1.6 | | 2011-12-31 | 1.5 | | 2011-12-31 | 1.4 | | 2011-12-31 | 1.3 | | 2011-12-31 | 1.2 | | 2011-12-31 | 1.1 | | 2011-12-31 | 1.0 | | 2011-12-31 | 0.9 | | 2011-12-31 | 0.8 | | 2011-12-31 | 0.7 | | 2011-12-31 | 0.6 | | 2011-12-31 | 0.5 | | 2011-12-31 | 0.4 | | 2011-12-31 | 0.3 | | 2011-12-31 | 0.2 | | 2011-12-31 | 0.1 | | 2011-12-31 | 0.0 | | Current Control: Range: -9 to -6, Current Control: -6 to -4, Current Control: -4 to -3, Current Control: -4 to -3, Current Control: -4 to -3, Current Control: -4 to -3, Current Control: -4 to -3, Current Control: -4 to -3, Current Control: -4 to -3, Current Control: -4 to -3, Current Control: -4 to -3, Current Control: -4 to -3, Current Control: -4 to -3, Current Control: -4 to -3Example 2:
Set the Offset to "4000" (refer to Diagram S and S1). The screen shows 4000 as the starting point for the 8,000 record total.

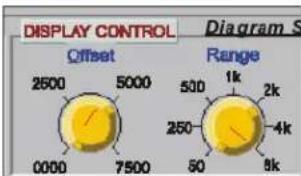
Display Control (for X-Axis records)
Range - Allows the user to configure the data range.
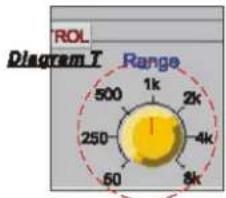
Example 1:
Set the Range by clicking & dragging the red indicator (Diagram T) to "1K" (Diagram T-1 shows data records from 0001 to 1000).

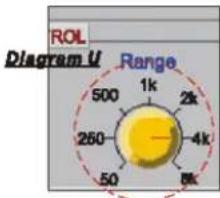
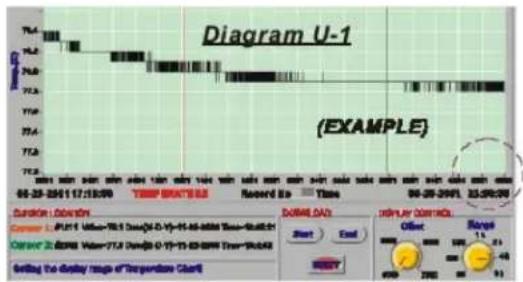
Example 2:
Set the Range to "4K" as in Diagram U. Diagram U-1 shows the data records from 0001 to 4001.
line
| Time | Temperature (°C) | | ---------- | ---------------- | | 06-25-2011 17:18:00 | 77.4 | | 07-01-2011 | 77.3 | | 07-04-2011 | 77.2 | | 07-07-2011 | 77.1 | | 07-10-2011 | 77.0 | | 08-01-2011 | 76.9 | | 08-04-2011 | 76.8 | | 08-07-2011 | 76.7 | | 08-10-2011 | 76.6 | | 09-01-2011 | 76.5 | | 09-04-2011 | 76.4 | | 09-07-2011 | 76.3 | | 09-10-2011 | 76.2 | | 10-01-2011 | 76.1 | | 10-04-2011 | 76.0 | | 10-07-2011 | 75.9 | | 10-10-2011 | 75.8 | | 11-01-2011 | 75.7 | | 11-04-2011 | 75.6 | | 11-07-2011 | 75.5 | | 11-10-2011 | 75.4 | | 12-01-2011 | 75.3 | | 12-04-2011 | 75.2 | | 12-07-2011 | 75.1 | | 12-10-2011 | 75.0 | | 13-01-2011 | 74.9 | | 13-04-2011 | 74.8 | | 13-07-2011 | 74.7 | | 13-10-2011 | 74.6 | | 14-01-2011 | 74.5 | | 14-04-2011 | 74.4 | | 14-07-2011 | 74.3 | | 14-10-2011 | 74.2 | | 15-01-2011 | 74.1 | | 15-04-2011 | 74.0 | | 15-07-2011 | 73.9 | | 15-10-2011 | 73.8 | | 16-01-2011 | 73.7 | | 16-04-2011 | 73.6 | | 16-07-2011 | 73.5 | | 16-10-2011 | 73.4 | | 17-01-2011 | 73.3 | | 17-04-2011 | 73.2 | | 17-07-2011 | 73.1 | | 17-10-2011 | 73.0 | | 18-01-2011 | 72.9 | | 18-04-2011 | 72.8 | | 18-07-2011 | 72.7 | | 18-10-2011 | 72.6 | | 19-01-2011 | 72.5 | | 19-04-2011 | 72.4 | | 19-07-2011 | 72.3 | | 19-10-2011 | 72.2 | | 20-01-2011 | 72.1 | | 20-04-2011 | 72.0 | | 20-07-2011 | 71.9 | | 20-10-2011 | 71.8 | | 23-05/20 | - |Battery Replacement
Follow these steps to remove and replace the battery:
- Remove the four (4) rear Phillips-head screws
- Ensure that the o-ring remains in its groove.
- Remove the expired battery.
- Insert a new battery (CR2) ensuring correct polarity.
- Fasten the four rear screws.
Specifications
| Display | 3-digit | multi-function | LCD |
| Front panel status LEDs | Two (2): RECORD and ALARM | ||
| Temperature range | -40 to 185 | °F (-40 to 85°C) | |
| Temperature resolution | 0.1 | °up to 99.9°; 1°from 100° to 185° | |
| Temperature accuracy | ±1.2 | °F (0.6°C) from -4 to 122°F (-20 to 50°C) | |
| ±°F (1.2°C) all other ranges | 4 | ||
| Humidity range & accuracy | 0.0 to 99.9% | Relative Humidity; Accuracy: ±3% | |
| Datalogger storage | 16,000 temperature readings (8,000 temperature and 8,000 humidity readings on the 42270) | ||
| Sampling rate | Programmable from 1 second to 12hours | ||
| Power supply | One 3.6V 1⁄2 ‘AA’ lithium battery | ||
| Battery Life | 1 year: 5 second sample rate in sleep mode | ||
| 3.8 months: 24 hour sample rate in non-sleep mode | |||
| Low battery indicator | Display shows ‘LO’ | ||
| Cable length | 60” (150cm) | ||
| Operating Temperature | 32 to 104°F (0 to 40°C) (docking station) | ||
| Operating Humidity | 10 to 80% RH (docking station) | ||
| Dimensions | 4.9 x 3.6” (124 x 92mm) | ||
Warranty
EXTECH INSTRUMENTS CORPORATION warrants this instrument to be free of defects in parts and workmanship for one year from date of shipment (a six month limited warranty applies to sensors and cables). If it should become necessary to return the instrument for service during or beyond the warranty period, contact the Customer Service Department at (781) 890-7440 ext. 210 for authorization or visit our website www.extech.com for contact information. A Return Authorization (RA) number must be issued before any product is returned to Extech. The sender is responsible for shipping charges, freight, insurance and proper packaging to prevent damage in transit. This warranty does not apply to defects resulting from action of the user such as misuse, improper wiring, operation outside of specification, improper maintenance or repair, or unauthorized modification. Extech specifically disclaims any implied warranties or merchantability or fitness for a specific purpose and will not be liable for any direct, indirect, incidental or consequential damages. Extech's total liability is limited to repair or replacement of the product. The warranty set forth above is inclusive and no other warranty, whether written or oral, is expressed or implied.
Calibration and Repair Services
Extech offers repair and calibration services for the products we sell. Extech also provides NIST certification for most products. Call the Customer Service Department for information on calibration services available for this product. Extech recommends that annual calibrations be performed to verify meter performance and accuracy.

Support line (781) 890-7440
Technical support: Extension 200; E-mail: support@extech.com Repair & Returns: Extension 210; E-mail: repair@extech.com
Product specifications subject to change without notice For the latest version of this User's Guide, Software updates, and other up-to-the-minute product information. visit our website: www.extech.com Extech Instruments Corporation, 285 Bear Hill Rd., Waltham, MA 02451
Copyright © 2008 Extech Instruments Corporation
All rights reserved including the right of reproduction in whole or in part in any form.

- Introduction
- Applications
- The datalogger module display will not switch on until activated through the software
- Important note on the Model 42280 Temperature/Humidity Datalogger
- Description
- Displays
- LCD Display
- Recording Status Indication
- ALARM Status Indication
- Low Battery Indication
- LNK PC Link Screen
- Installation Instructions for models 42265 and 42275
- Setup menu description
- Cursor 1 and 2 Control
- Offset Knob
- Zoom and Pan on Graphs
- Horizontal Axis select switch
- Warning message
- Display Control
- Save File
- Retrieve File
- Com Port Setup
- Datalogger Settings
- Number of Data Points
- Sample Rate
- Start Modes
- Scheduled Start
- Magnetic Start
- Immediate Start
- Start Mode Setup
- Datalogger Clock Setting
- Alarm Setting
- The ALM LED flashes:
- Unit Setting
- Data Logger ID Setting
- Sleep Mode Setting
- Data Table
- Goto
- Find
- Statistics
- Print Graph
- Group Files
- Temperature Chart
- Cursor Status
- Previous Setting
- Message
- Download Commands
- Example 2:
- Display Control (for X-Axis records)
- Example 1:
- Battery Replacement
- Warranty
- Calibration and Repair Services
- Support line (781) 890-7440
Brand : Extech
Model : 42265
Category : Thermometer