EVTCRU - Measurement Comark - Free user manual and instructions
Find the device manual for free EVTCRU Comark in PDF.

| Product Type | Portable Temperature Measurement Device |
| Model | EVTCRU |
| Brand | Comark |
| Category | Measurement |
| Dimensions (approx.) | 180 x 70 x 30 mm |
| Weight (approx.) | 200 g (including batteries) |
| Power Supply | 2 x AA batteries (1.5V) |
| Battery Life | Approximately 200 hours continuous use |
| Measurement Range | -50°C to 1000°C (depending on probe) |
| Accuracy | ±0.5°C (±1°F) from -10°C to 150°C |
| Display | Backlit LCD, 4-digit |
| Probe Input | Type K thermocouple (mini connector) |
| Data Logging | Up to 10,000 readings with timestamps |
| Interfaces | USB for data download |
| Software | Compatible with Comark Data Logger software (Windows) |
| IP Rating | IP54 (splash resistant) |
| Operating Temperature | 0°C to 50°C (32°F to 122°F) |
| Storage Temperature | -20°C to 60°C (-4°F to 140°F) |
| Calibration | User calibration offset adjustment |
| Maintenance | Clean with damp cloth; dry storage; replace batteries as needed |
| Safety | Compliant with EN 61010-1; overvoltage protection |
| Spare Parts | Battery compartment cover, USB cable, rubber boot available |
| Warranty | 2 years (excluding batteries and probes) |
Frequently Asked Questions - EVTCRU Comark
User questions about EVTCRU Comark
0 question about this device. Answer the ones you know or ask your own.
Ask a new question about this device
Download the instructions for your Measurement in PDF format for free! Find your manual EVTCRU - Comark and take your electronic device back in hand. On this page are published all the documents necessary for the use of your device. EVTCRU by Comark.
USER MANUAL EVTCRU Comark
Issue 15 June 7 ^th 2016
Copyright © Comark Instruments June 2016
The informaon contained in this document is the intellectual property of Comark Instruments, and may not be used by any other company or individual in a form, which may be sold or used for commercial gain. The sole purpose of provision of this operator manual is to assist the requirement of a customer to program and retrieve data from an EV Logger. No liability is accepted if this results in calibraons or conguraons being inadvertently overwrien.
Contents
INTRODUCTION ....5
EVSW UPDATE SUMMER 2016 ....5
VALIDATION NOTE....5
EXPLANATION OF TERMS....5
Diligence Ev
RANGE INTRODUCTION ....5
OVERVIEW OF EVOLUTION FUNCTIONS....6
INSTALLATION AND RUNNING THE SOFTWARE 6
EVSW PRO FIRST USE....7
LANGUAGE SELECTION....7
FIRST ADMINISTRATOR....7
CREATING/EDITING/CHANGING USERS/NEW USERS/ADMINISTRATORS 8
SWITCHING BETWEEN USERS....9
CHANGING YOUR PASSWORD ....10
LOGGING OFF....10
GETTING STARTED - USING THE EV SOFTWARE ....11
EV ICONS....11
SOFTWARE - SETUP OPTIONS....13
AUTO DOCK/TIMEOUT/TIMEOUT REMINDER....13
MAINTAIN SCREEN ASPECT RATIO ON GRAPH PRINTOUTS 14
Auto Zoom 14
USE HIGHER COMMS SPEED IF AVAILABLE ....14
USE WINDOWS TIME/DATE FORMAT ....14
FORCE LOGGER INTO NON-LOGGING MODE (SUPER USER ONLY) (EV PRO ONLY)....14
AUTOMATIC DOWNLOAD (EV PRO ONLY) 14
DEFAULT TIME AXIS MODE 15
COPY GRAPH TO CLIPBOARD....15
COLOURS....15
ARCHIVING....15
INTRODUCING A LOGGER FOR THE 1 ^ST TIME....17
WRITING TASKS FOR EV LOGGERS....18
CREATING TASKS....18
QUICK PROGRAM 18
CREATE TASK FROM A TASK....19
CREATE NEW TASK FOR SELECTED MODEL 19
COMPLETING THE TASK FORM 20
GENERAL SETUP....20
LOGGING SETUP....20
MISCELLANEOUS LOGGING SETUP....22
PROGRAMMING TASKS TO LOGGERS ....22
SELECTING A TASK TO BE PROGRAMMED TO A LOGGER....22
ONCE A TASK HAS BEEN PROGRAMMED....22
LOGGING MODES ......23
MANUAL START/STOP MODES EV AND EVT 23
Delayed Start (EVt Only)....23
AUTOMATIC START/STOP MODES EV AND EVT 23
RETRIEVING DATA FROM EV LOGGERS....23
AUTOMATIC TIME-ZONE CORRECTION....23
IMPORTANT NOTE REGARDS EV PRO AND 21 CFR PART 11....23
GRAPHING DATA 24
ADDING ANNOTATIONS ....24
GRAPH TITLE....25
ZOOM FUNCTION 25
CALCULATIONS....26
CREATING MULTI-GRAPHS....27
PRINTING 28
EVSW DATABASE....29
DATABASE DESCRIPTION....29
EDITING TASKS/SESSIONS 29
TASK USEFUL INFORMATION....30
FILTERING/SORTING TASKS/SESSIONS EV STANDARD VERSION....30
FILTERING TASKS EVSW PRO 32
Delete Tasks 34
Eding Visible Task Columns....35
FILTER RE-CALL 36
AUDIT TRAIL EVSW PRO ONLY 37
Open Audit Trail 37
APPENDIX 1 - MEAN KINETIC TEMPERATURE/LETHALITY/PASTEURISATION (EV PRO ONLY)......40
MEAN KINETIC TEMPERATURE (MKT) 40
LETHALITY....41
PASTEURISATION 41
APPENDIX 2 - TITLE 21 CFR PART 11....42
WHAT IS 21 CFR PART 11?......42
TITLE 21 CFR DEFINITIONS ....42
ELECTRONIC SIGNATURES....43
AUDIT TRAILS 43
21 CFR PART 11 POLICY STATEMENT ....43
21 CFR PART 11 RESTRICTIONS ....43
APPENDIX 3 - EV AND EV PRO DIFFERENCES....44
APPENDIX 4 – PASTEURISATION VALUES......45
APPENDIX 5 IP67 AND EN 12830....46
IP67 46
BS EN12830....46
APPENDIX 6 – EVT2 DATA LOGGER LCD ENUNCIATORS ....47
APPENDIX 7 - N2000 DATA LOGGER LCD ENUNCIATORS....48
APPENDIX 8 – SPECIFICATIONS....49
APPENDIX 8 –WIRING N2015....52
Introduction
EVSW Update Summer 2016
This guide has been written alongside a new version of the EVSW Soware with crucial behind the scenes updates for Windows 10.
In addition to these changes Comark has undertaken to re-write the Soware Interface to give it a more modern look and feel.
The soware is fully compatible with original versions of EVSW and EVSW PRO and therefore you can upgrade from earlier versions to this new version.
Validation Note
Please note that if you are running the EVSW PRO version and you have Validated the Soware then this version will require re-validaon to ensure that it is compatible with your processes. If unsure please contact Comark for assistance.
Explanation of Terms
Throughout this manual the following terms are used for clarity: -
User = anyone who uses the soware for programming and retrieving data from the EV range of loggers
Administrator = the user who has been designated to authorise whoever else in the organisaon can be users or administrators.
Super User = An administrator whose password does not expire.
ICONS = Primary EV soware funcons.
Tasks = A series of instrucons for a logger in order for that logger to perform a logging duty.
Dock = The dock is the term used in the soware which refers to the interface or cradle for the logger.
Session = A period of data downloaded from a logger.
Diligence EV Range Introducon
There are 6 EV models available:
EVt2 Single internal temperature data logger with display
N2011 Single internal temperature data logger with display
N2012 Internal and 4 external temperature data logger with display
N2013 Humidity and temperature data logger with display
N2014 3 Channel thermocouple + Ambient data logger with display
N2015 Single Channel 4-20mA Current Loop Logger with display
Overview of Evoluon Funcons
The range of instruments has a built in memory for storage of up to 16000 readings.
These readings are sent directly to a PC via the USB interface. Logger operaon is via the navigaon buon on the front of the logger. This controls all the logging funcons and acts as alarm acknowledge.
External sensor conncon to the N2000 loggers is via the proven Lumberg connector, which allows standard Comark probes to be used where applicable. All loggers feature alarm me delay and Password protecon.
All Diligence EV data loggers have a green LED indicator to show that the data logger is acve and a red LED indicator to alert the operator when an alarm condition is detected.
Programming and data retrieval using Comark Evoluon soware is performed by infrared communicaons (via the USB Interface, part number EVTCRU or N2000CRU) for convenience and reliability.
The Ev soware has been specially developed for use with all Loggers.
Installation and Running the software
EV Soware comes in two dierent versions
- EVSW – Standard Version of the Soware
- EVSWPRO – Professional Version of the Soware for applicaons requiring 21 CFR Part 11
If you are running EVSW Standard Soware please jump to Secon.... See Geng Started - Using the EV soware
If you are running EVSWPRO Professional Soware please jump to Secon.... See EVSW PRO First Use
EVSW PRO First Use
Click on the Desktop Icon to run the soware.
Language Selection
Please select from one of the available languages....
(At me of wring this includes, English, English United States, Spanish, Finnish, French, Italian, Norwegian, Swedish)

text_image
Select Language Cancel OKClick OK to conrm.
First Administrator
In order to use the soware, Administrators and Users must be added. The soware will automatically request that a First Administrator be setup on the soware.
Simply enter a Username, Password and ck the box for Administrator, see below...

text_image
System users ID Name 1 Comark 2 Andy User settings Disabled Administrator Name Andy Password ****** Enabled system functions All ON All OFF Function Enalt... Electronic signer ✓ Modify options ✓ Modify tasks ✓ Create new task ✓ Program task ✓ Add/modify graph annotations ✓ Create/modify multiple graphs ✓ Print graphs/data ✓ Filter tasks/sessions ✓ View or print audit trail ✓ User password expires ✓ Change language ✓ Please note that a user cannot be deleted and a user name cannot be changed once that user has signed or edited a record New User Delete User Password expiry period (days) 90 Set expiry for all OKThen Click on OK and subsequently click OK to conrm this message...
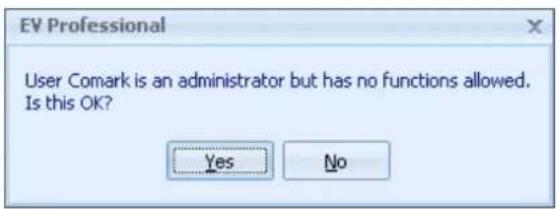
text_image
EV Professional User Comark is an administrator but has no functions allowed. Is this OK? Yes NoThe First Administrator setup is now complete.
Creating/Editing/Changing Users/New Users/Administrators
Adding new Users or Administrators is very simple. Select Edit-Edit Systems Users and the following dialog box will be displayed:
Re-enter your password and click on OK.
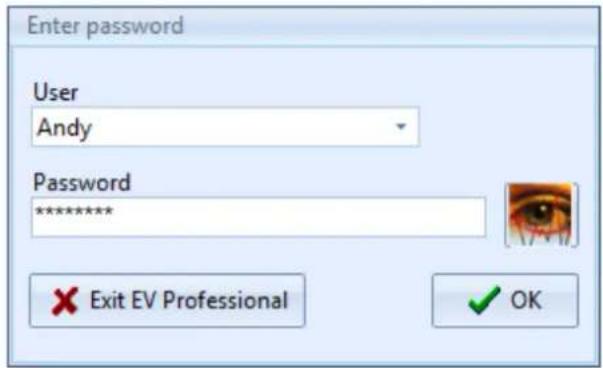
text_image
Enter password User Andy Password ****** Exit EV Professional OKThe System Users setup screen will be displayed:
To set up a new User/Administrator click on the 'New User' Icon. Change the name as required.
To set up a User then simply select the individual features from the list that the new user is to have access to.
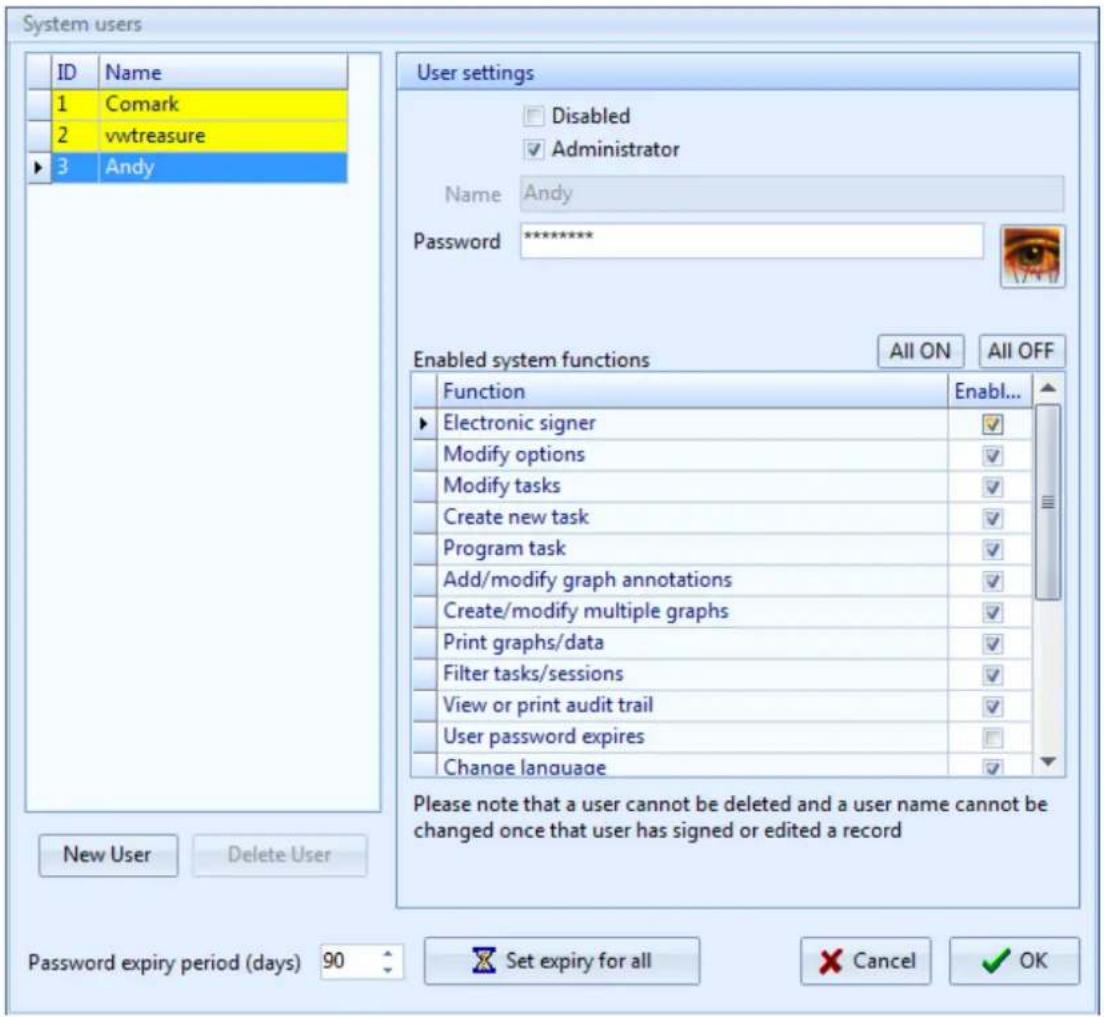
text_image
System users ID Name 1 Comark 2 vwtreasure 3 Andy User settings Disabled Administrator Name Andy Password ********* Enabled system functions All ON All OFF Function Enabl... Electronic signer ✓ Modify options ✓ Modify tasks ✓ Create new task ✓ Program task ✓ Add/modify graph annotations ✓ Create/modify multiple graphs ✓ Print graphs/data ✓ Filter tasks/sessions ✓ View or print audit trail ✓ User password expires ✓ Change language ✓ Please note that a user cannot be deleted and a user name cannot be changed once that user has signed or edited a record New User Delete User Password expiry period (days) 90 Set expiry for all Cancel OKHere it is possible to amend any user prole as an administrator or to add another user/administrator prole to the sware.
It is recommended that all users of the soware for programming and data retrieval are set up as Users and that all Administrators are purely for admin access only. All users can be given rights as though they are in fact Administrators for the purposes of using the soware, except for the ability to create new users and administrate existing ones.
If the user is to be an Administrator then click on the administrator buon as above to select all the items. In this case as the second or third administrator it is possible to select 'User password expires' so that the password will expire aer the pre-set me. Expiry dates are set in days.
To set up a User then simply select the individual features from the list that the new user is to have access to.
Select any or all of the items from the list. This gives ulmate exibility and control over who has access to what, and provides the best protecon against unauthorised use of the soware.
It is recommended that all passwords are at least 8 characters long and include a mixture of leers and numbers.
However they can be as short as required. Use the buon to check that the password you have entered is correct.
Passwords are not case sensitive.
If a user logs on incorrectly three mes in a row then he/she will not be allowed to log on to the system until he/she has been re-instated by an Administrator. To re-enable a user use the same process as above but this me un-ck the box marked disabled to re-instate the user. If necessary at this me the password can be changed.
If there is any suspicion that a password has been lost or that another user has been given another users password then change it immediately.
Once that the Users and Administrators have all been set up it is possible to use the soware with your data loggers. Further users/administrators (up to 3) can be added at any me. However there is no praccal limit to the number of ordinary users.
Switching Between Users
Whilst logged in it is possible to switch between users. Simply select Edit-Change User. Select the new user from the drop down menu and enter the new password.
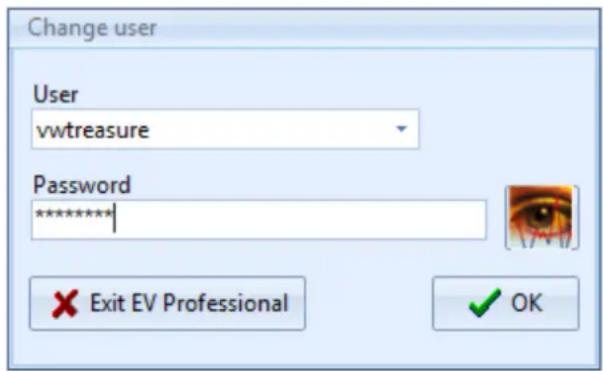
text_image
Change user User vwtreasure Password ******** Exit EV Professional OKPress OK to nish.
Changing Your Password
To change a password at User level rst log on to the soware.
The select 'Edit-Change Password'. The following screen will be displayed:

text_image
Change password Old password ****** New password ****** Confirm new password ******** Cancel OKSimply enter the exisng User password followed by the new password then a repeat of the new password. Click on
the icon at any me to view the password.
Logging Off
It is not possible to log-o the soware whilst leaving the soware open. When you are nished close the soware down. All the data you have generated will be saved. The next User/Administrator will simply open the soware and login as normal.
Getting Started - Using the EV software
Once logged in, in the case of the Pro version or simply opened, EV Standard, then the soware will look like this:
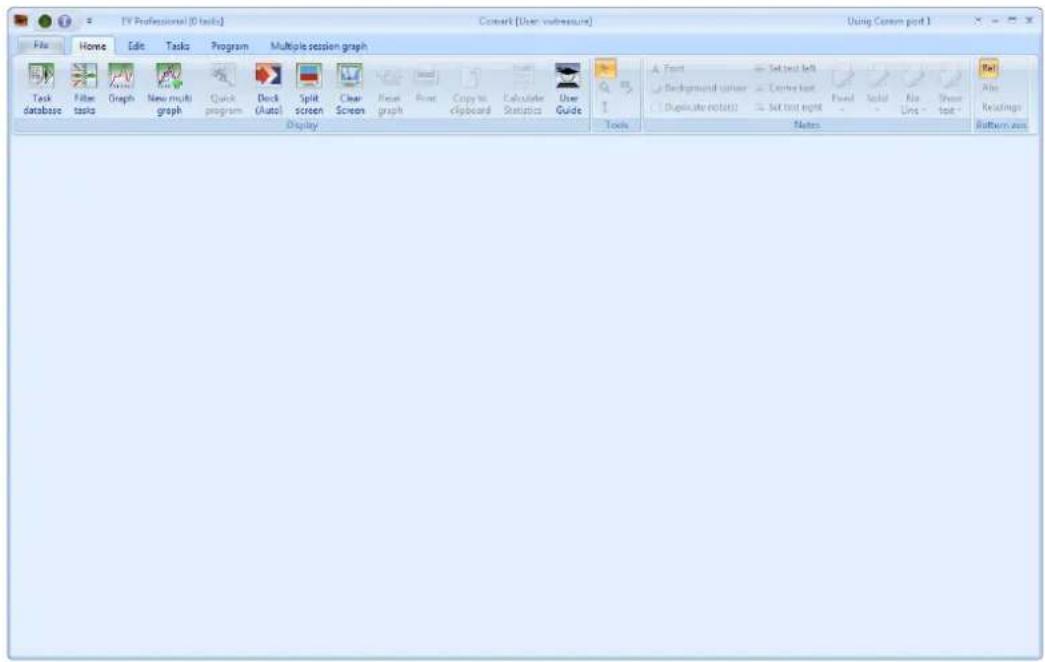
text_image
X-ray Professional (0 tasks) Concept [User: volume] Using Corem port 1 File Home Edit Tasks Program Multiple session graph Task database Filters tasks Graph New multi graph Quick program Deck (Auto) Split screen Clear Screen Print Copy to Clipboard Calculate Statistics User Guide Display Histogram Print Copy to Clipboard Calculate Statistics Tools Text Background (user) Duplicate (rctats) Set text left Caribe text Set text right Fixed Solid Lines View Text Notes Auto Readings Bottom axisAlong the top of the screen will be the version of soware in use followed by the logged on user, if applicable, and then the communicaons port in use.
EV ICONS
Along the top of the screen are a number of ICONS which are used to navigate through the soware.
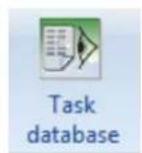
The Task database Icon will take the user to the task database view. This is a lisng of all programs that have been written for EV loggers.
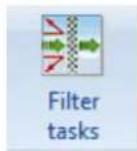
The Filter task Icon will take the user to the Iter opons menu for task and session data.
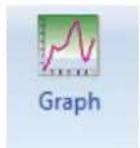
The Graph Icon will take the user to the graph and data lisng view.
The Mul-Graph Icon will take the user to the mul-graph selecon screen.

This is the Quick Program Icon. It has two modes one to show acve (full colour) and one to show inacve (black and white). If Quick Program is acve then the dock will have an acve logger ed. For more informaon Quick program, click here.

This is Quick Program (inacve). In this case the dock is most likely empty or the logger in the dock is inacve.

This is the Automac 'Dock' Icon. This Icon has four modes. This one shows 'Dock' to indicate that nothing is in the dock or the logger in the dock is not acve.
This is the Automac 'Docked' Icon. This indicates that there is an acve logger in the dock.

This is the Manual 'Dock' Icon. In this case indicang that the dock is empty. In this mode the Icon must be selected to check the status of the Dock.

This is the Manual 'Docked' Icon. In this case indicang that a logger is in the dock.

This is the Split Screen Icon. Selecng this will change the screen view to split screen to show the task database, graph and list data where applicable.

This is the clear screen Icon. Selecting this will clear the screen of all task and data.
This is the Reset Graph Icon. Selecng this will reset the graph back to the original.

This is the Print Icon. Selecting this will initiate the Print Opons.

This is the Copy to Clipboard Icon. Selecng this will copy the current Graph view to the Clipboard.
This is the Calculate Stascs Icon. Selecng this will calculate the stascs for the currently selected Logger Data Set.
Software - Setup Options
The EV soware has some set up features that need to be explained before the soware is used for the rst me.
Note: For EV PRO users' access must have been given to Modify Opons to make any changes to this secon.
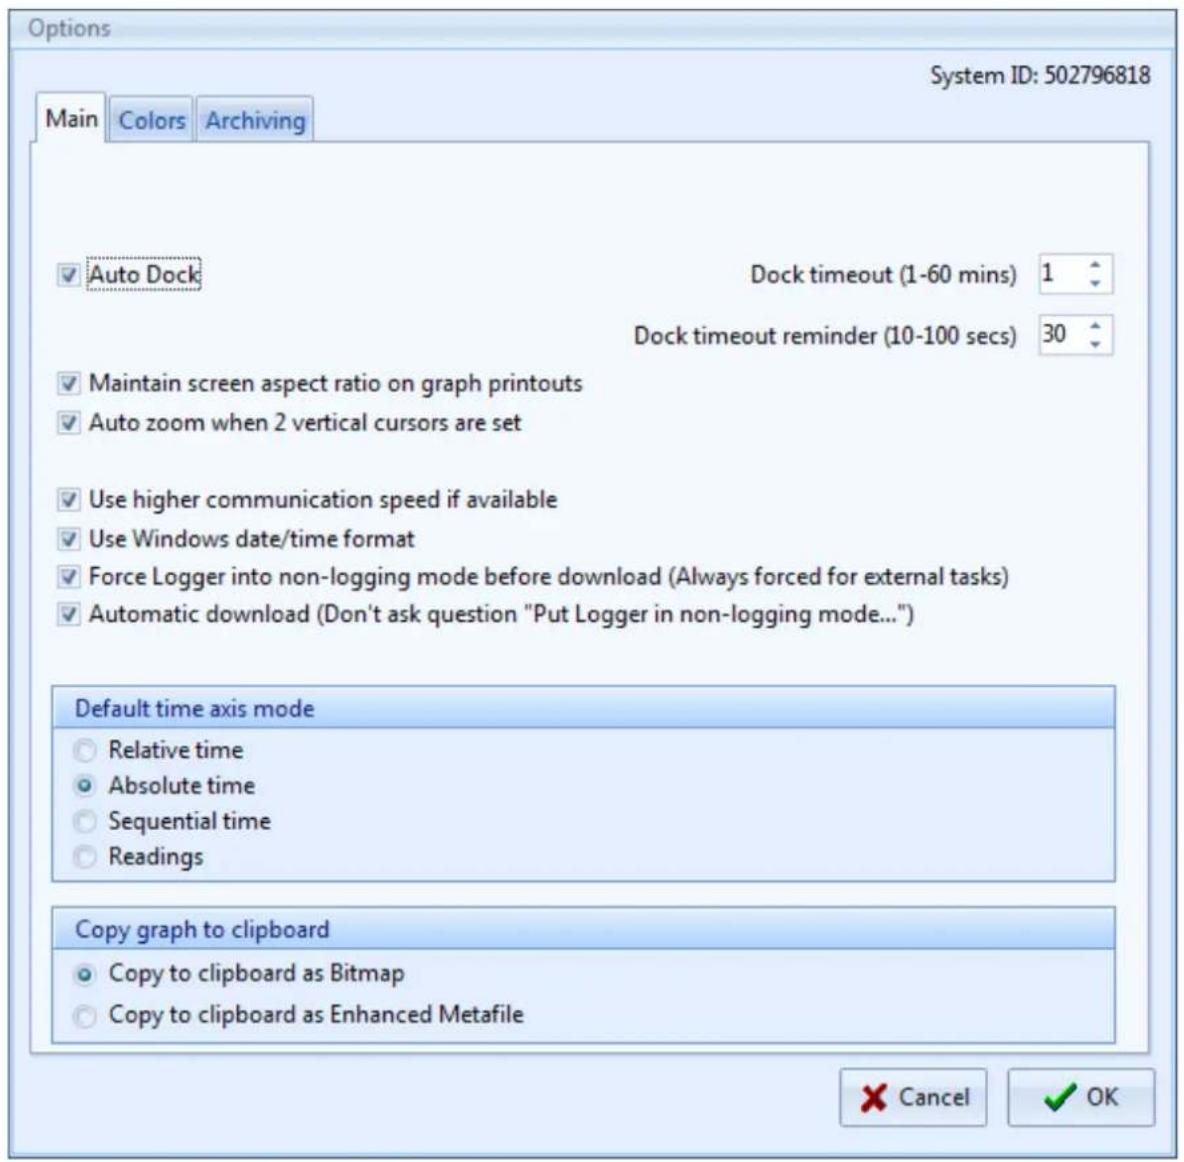
Select Edit-Opons to bring up the Preferences screen, see below.
text_image
Options System ID: 502796818 Main Colors Archiving Auto Dock Dock timeout (1-60 mins) 1 Dock timeout reminder (10-100 secs) 30 Maintain screen aspect ratio on graph printouts Auto zoom when 2 vertical cursors are set Use higher communication speed if available Use Windows date/time format Force Logger into non-logging mode before download (Always forced for external tasks) Automatic download (Don't ask question "Put Logger in non-logging mode...") Default time axis mode Relative time Absolute time Sequential time Readings Copy graph to clipboard Copy to clipboard as Bitmap Copy to clipboard as Enhanced Metafile Cancel OKNote: The default for ck boxes is all cked.
Auto Dock/Timeout/Timeout Reminder
Auto dock is set as standard. In this mode the EV soware will operate automatically to download loggers. However while a logger is in the dock it will be using baery power at a higher than normal rate. Therefore it is recommended that the Dock Timeout and Dock reminder sengs are set as short as possible.
Maintain screen aspect ratio on graph printouts
If this box is cked then graph printouts from the EV soware will maintain the same aspect rao as they have on screen. In this case the printout will be exactly as per the image on the screen.
If this box is not cked then the printout will be stretched to t the page. See Prinng.
Auto Zoom
Using the Vercal Line funcon on the graph can enable automac zooming to those sengs when the mouse is released. See Graphing data.
Use higher Comms speed if available
This box should remain cked for use with USB Dataloggers.
Use Windows Time/Date format
Date and me informaon for logged data will be shown in the database in the same format as the Windows date and me if this box is cked.
Force logger into non-logging mode (Super User Only) (EV Pro Only)
In certain circumstances loggers that are le on the cradle or introduced to the cradle may sll be logging when downloaded. In these circumstances if the logger is not stopped and returned to non-logging mode then there is a possibility that data may be lost. With this box cked then no data is lost, as the logger will be taken out of logging mode before it is downloaded. If the box is not cked but the logger is rst stopped before downloading is acvated then again no data will be lost. Un ck this box only when a logger is required to be re-used with the same task but you want to be able to download data during a logging session. Each me the logger is downloaded will create a new session of data.
If the logger was programmed on another PC or the task has been signed then the logger will always be downloaded and placed in non-logging mode.
This opon should never be un-cked in a 21 CFR Part 11 environment, and as such can only be disabled by the Super User.
Automatic download (EV Pro Only)
This opon is used in conjuncon with 'Force logger into non-logging mode' see above. If the box above is not cked then the soware will place the logger into non-logging mode if appropriate automacally should it be required before the data is downloaded. If this box is le un-cked then the user will be warned that the logger needs to be placed in non-logging mode before download can take place. Thus giving the opon not to download at that me. Leave this box cked for automac download of data with no need for user intervenon.
Default Time Axis Mode
It is possible to set the automac default for the scale sengs on mulple graphs.
- Relave Time – All me bases will be referenced to 00:00:00
- Absolute Time – All the me bases will be drawn on a real me scale.
- Sequential Time – All the me bases will be drawn one aer the other.
- Readings – All graphs will be drawn referenced to the number of readings starng from zero each me.
Copy Graph to Clipboard
It is possible to copy the graph to the clipboard for export to another package such as Word or for copying to a presentaon or other report. There are two opons for the export of the graph, either Bitmap (drawing) or enhanced metale (scalable drawing).
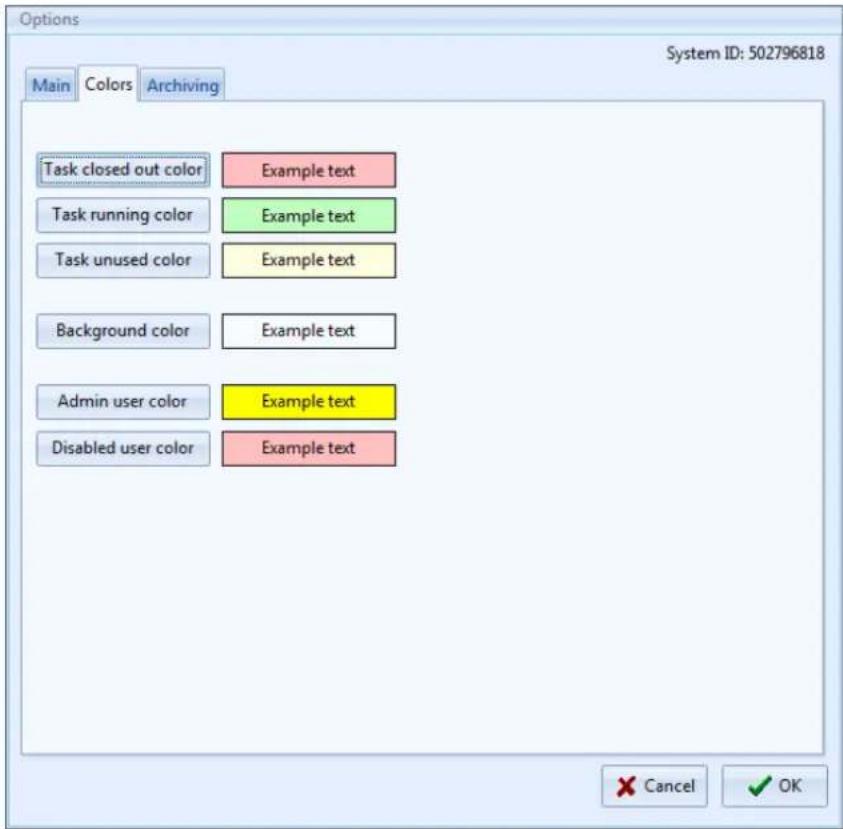
Colours
Select Colours from the tab at the top of the screen to reveal the selecon of colours available, see below.
text_image
Options System ID: 502796818 Main Colors Archiving Task closed out color Example text Task running color Example text Task unused color Example text Background color Example text Admin user color Example text Disabled user color Example text Cancel OKHere it is possible to set the colours for the features as described above. These colours are freely selectable. Simply select one of the tabs in the le column and choose another colour. The selecon will be saved on exit from the program.
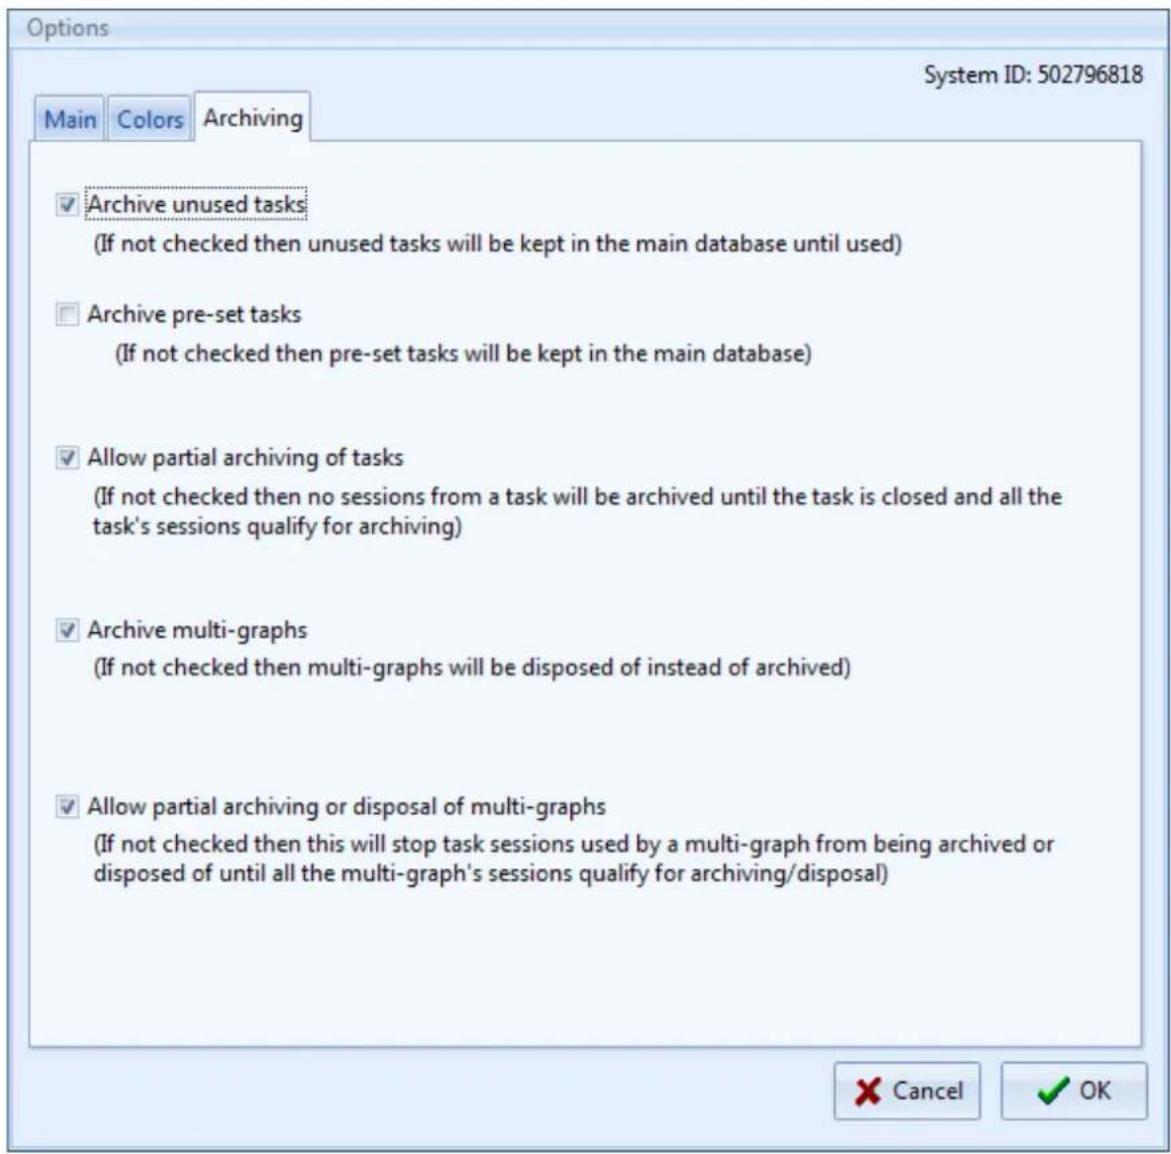
Archiving
Database tasks cannot be deleted from the system unless there are unused, i.e. they have not been programmed into a logger. However as the soware is used, more and more tasks will build up. Occasionally it is suggested that the database is archived. This database can be opened again at any me thereaer to review the data.
Note: If using EV PRO then the requirements of 21 CFR Part 11 will require the User to Electronically Sign any unsigned data in the database before it can be archived. Refer to Signing Tasks for more details.
The archive opons are listed below:
text_image
Options System ID: 502796818 Main Colors Archiving ✓ Archive unused tasks (If not checked then unused tasks will be kept in the main database until used) ☐ Archive pre-set tasks (If not checked then pre-set tasks will be kept in the main database) ✓ Allow partial archiving of tasks (If not checked then no sessions from a task will be archived until the task is closed and all the task's sessions qualify for archiving) ✓ Archive multi-graphs (If not checked then multi-graphs will be disposed of instead of archived) ✓ Allow partial archiving or disposal of multi-graphs (If not checked then this will stop task sessions used by a multi-graph from being archived or disposed of until all the multi-graph's sessions qualify for archiving/disposal) Cancel OKSelect OK to complete set up. All changes will be saved when you exit from the soware.
To archive the database select File-Archive Database. The following image will appear:

text_image
Archive database by date Archive all records up to and including 06 June 2016 Cancel OKTo change the date select the 'Date' Icon and choose another date. When the date has been selected click on OK to complete the archive process. Note: This process may take a few minutes depending on the size of the archive le.
Introducing a logger for the 1^st time
At this stage it is possible to place a logger in the interface and begin using it with the EV sware.
Take a logger and press the navigaon buon on the front. For Diligence EV loggers place face down in the interface. EVt loggers should be placed face up. The EV soware will now interrogate the logger.

text_image
Logger docked... Searching for Logger...The EV soware will then return an informaon message as follows:

text_image
EV Professional No open tasks exist for docked Logger OKThis perfectly normal as the logger is not known to the soware. Press OK to connue. This message will be repeated whenever a new logger is introduced to the soware or one that does not have any tasks written for it at that me.
Note the change in state of the Quick Program ICON and the Docked Icon. Both of which will be acve now.
If no further acon is taken then the following informaon message will eventually be displayed:

text_image
EV Standard Logger model N2001/2011 has been in the dock for 1 min 0s Unless you are using it, please remove it to conserve the battery OKWhile this message is visible then the logger will not be using excessive current. Therefore if you are called away from the PC you will not be draining the logger baery.
To connue click on OK and remove the logger from the interface.
The Quick program and Dock Icons will return to their respective inacve states.
In this example N2011 logger is now known to the soware and tasks for it can be generated.
Note – A logger must be introduced to the soware before a Task can be wrien.
However the quickest way to program a logger is to use Quick Program. But quick program is only available when a logger is in the dock and acve. Please see below.
Writing tasks for EV loggers
Creating Tasks
A task can be generated in a number of dierent ways.
- Quick Program – used when a logger is in the dock and acve.
- Create a Task from a Task – used to repeat an existing task with only minor modicaon.
- Create a New Task for selected model – create a new task with no logger present.
Quick Program

Quick program is used when a logger is in the interface and is acve and a task is required quickly.
In Auto Dock mode take a logger and press the navigaon buon on the front. Place the EV logger face down (EVt face up) in the dock. The soware will recognise the logger automacally and the Quick Program Icon will become acvated. Note: If a logger contains un-retrieved data then this will be
downloaded rst.
Quick program will work in two dierent ways depending on the tasks available in the database. If no tasks exist for a logger, i.e. a new install of the soware or simply a new logger type that has not been introduced, then the soware will generate a blank task for that logger type.
However if tasks exist for the logger when an acve logger is placed in the dock then the task database will automatically liter to list only the tasks for that model and the current task will be highlighted in the list. In this case it is possible to select one of these tasks for quick program. Quick program will copy the informaon in the existing task to make the new one. Useful for waning to copy tasks with only small changes. Quick Program is the easiest way to create tasks for EV logger.
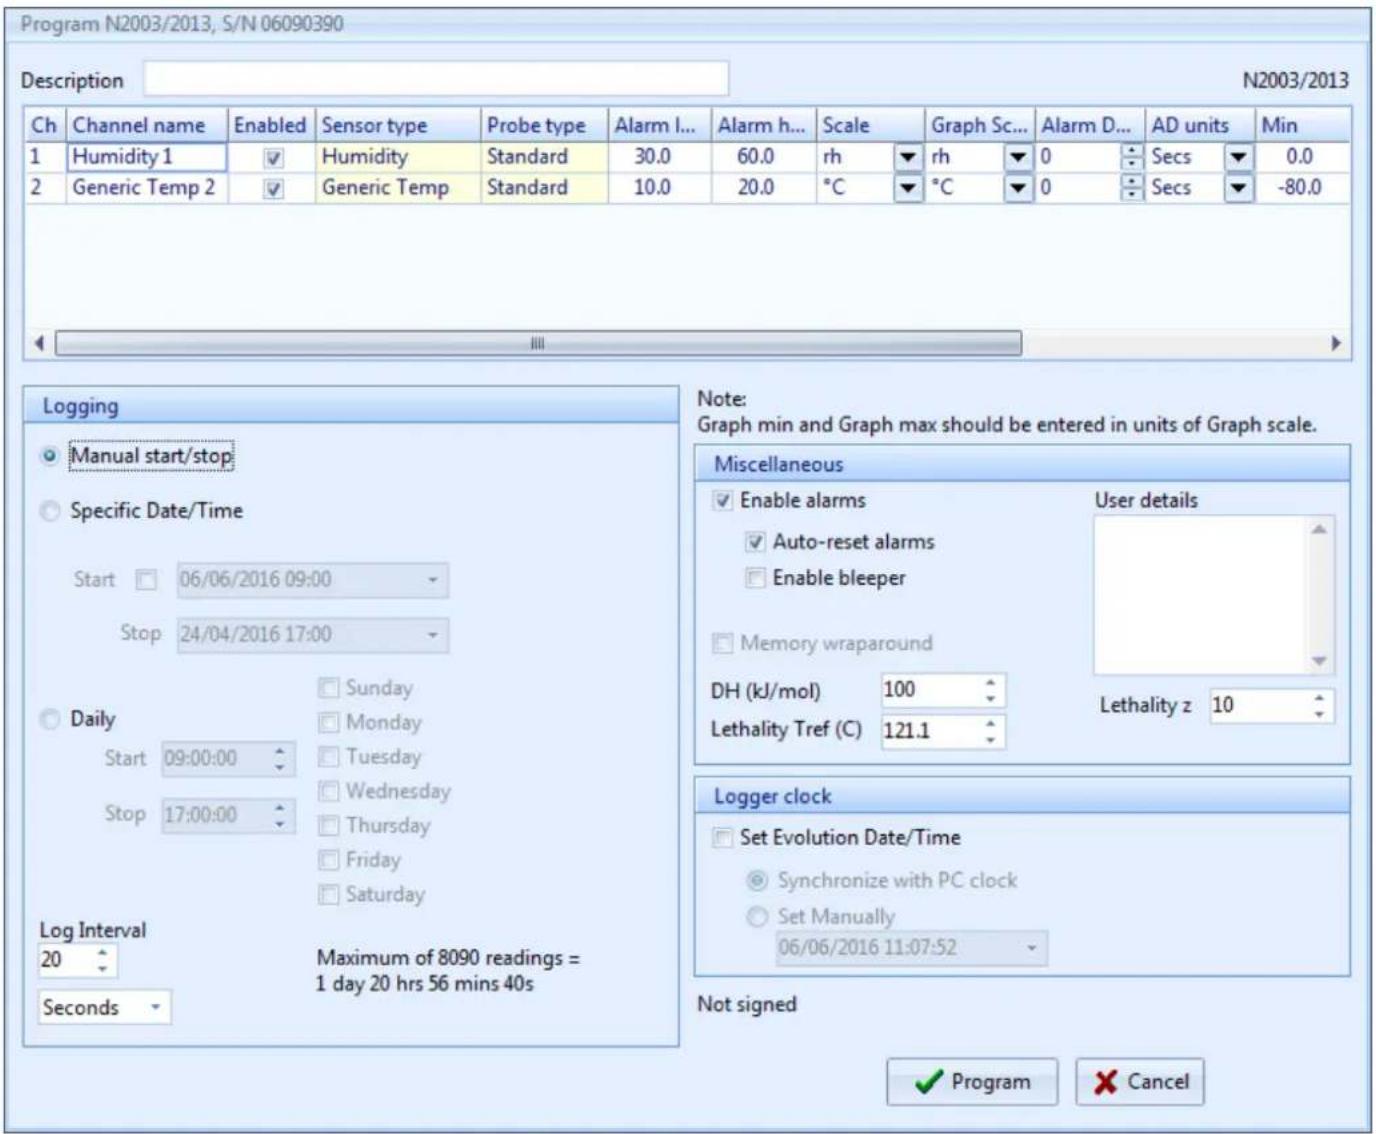
Press the quick program Icon and the soware will display a new task applicable to the logger in the dock. See below:
text_image
Program N2003/2013, S/N 06090390 Description N2003/2013 Ch Channel name Enabled Sensor type Probe type Alarm l... Alarm h... Scale Graph Sc... Alarm D... AD units Min 1 Humidity 1 ✓ Humidity Standard 30.0 60.0 rh ✓ rh ✓ 0 Secs ✓ 0.0 2 Generic Temp 2 ✓ Generic Temp Standard 10.0 20.0 °C ✓ °C ✓ 0 Secs ✓ -80.0 Logging Manual start/stop Specific Date/Time Start 06/06/2016 09:00 Stop 24/04/2016 17:00 Daily Sunday Monday Tuesday Wednesday Thursday Friday Saturday Log Interval 20 Maximum of 8090 readings = 1 day 20 hrs 56 mins 40s Seconds Note: Graph min and Graph max should be entered in units of Graph scale. Miscellaneous Enable alarms User details Auto-reset alarms Enable bleeper Memory wraparound DH (kJ/mol) 100 Lethality z 10 Lethality Tref (C) 121.1 Logger clock Set Evolution Date/Time Synchronize with PC clock Set Manually 06/06/2016 11:07:52 Not signed ✓ Program ✗ CancelThe task can be programmed to the Logger using the 'Program' buon. It will also be automatically saved to the task database.
If the logger has med out and is no longer acve then the task will be simply saved to the database.
Refer to Compleng the task form, see below, for more details on compleng the task.
Create Task from a Task

Select 'Tasks-Create task from a task' to generate a new task based on an existing task. Use this instead of Quick program when a logger is not present. When written the task can be saved to the database using the Save buon for use later.
Create new task for selected model
text_image
Create new task based on selected modelSelect 'Tasks-Create task for selected model' to generate a new task for a selected model of logger. Use this instead of Quick program when a logger is not present. When written the task can be saved to the database using the Save buon for use later.
Completing the task form
The task form has four areas, Descripon and General Setup, Logging Setup, miscellaneous and Logging Clock. At the top of the screen is the area for a task descripon plus the sengs for the channels on the logger. In this case an N2003/N2013 is in the dock.
General Setup
In this area, denoted by the display box at the top with scroll bar we several opons to modify:
- Turn channels ON/OFF
- Set Low Alarm
- Set High Alarm
- Set scales for each channel
- Set scales for graph display (This seng can be changed even aer data has been downloaded)
- Set Alarm Delay
- Set Units for Alarm Delay
Scrolling to the right will reveal that it is also possible to set the Graph Max and Min sengs for the Y-Axis of Temperature and RH. (Can be changed aer download)
The Colours used for the lines on the graph can also be set at this me. (Can be changed aer download)
The line width for the graph can also be changed. (Can be adjusted aer download)
In the lower half of the display we have three more seconds making up the complete task. These are dealt with below.
Logging Setup
On the le hand side of the screen we have the 'Logging' setup. It is here that we set the logger for:
- Manual Start/Stop
- Manual Start/Timed Stop
- Timed Start/Stop
• Daily Logging (not EVt) - Start Delay (EVt only)
- Log Interval
Manual Start/Stop
In this mode all EV loggers (except Evt 2) can be started and stopped any number of mes whilst. Each logging period will create a new session in the database. If wraparound is set (not EV Pro) then the earliest data will be over written.
Manual Start/Timed Stop
In this mode the EV logger will create one session only. The logger requires a manual start and will stop logging when the me is reached or the memory IIs up, whichever occurs 1st. If Wraparound is set (not EV Pro) it is possible to set a stop me whereby the logger will only record the last X readings, where X is the memory capacity of the logger. In this case the 1^st readings may be lost!
Timed Start/Stop
I this mode, the logger requires no manual intervenon and will start and stop automacally on the due mes. The logger cannot be manually stopped. If Wraparound is set (not EV Pro) then the stop me could be set into the future beyond the capacity of the logger. When the due date occurs and the logger nally stops recording only the last X readings will be stored, where X is the capacity of the logger.
Daily Logging
In this mode it is possible to select the day or days of the week where logging is to take place. It is also possible to set the start and stop mes during which the logger will log data. It is possible also to set logging to take place over midnight. If wraparound is NOT set the logger will connue to log unl full. If wraparound is set (not EV Pro) then the logger will connue to log indenitely unl downloaded. At this me the logger will contain only the last X readings where X refers to the memory capacity of the logger itself.
Start Delay (EVt Only)
For EVt logging it is possible to set a start delay for manual start logging. This is in the range 1 – 99 seconds, minutes, or hours.
Log Interval
A log interval for all modes can be programmed as either 1 – 99 seconds, minutes, or hours.
Logging Period
At every stage of logging set up the EV soware will indicate the logging period that can be achieved with the current sengs.
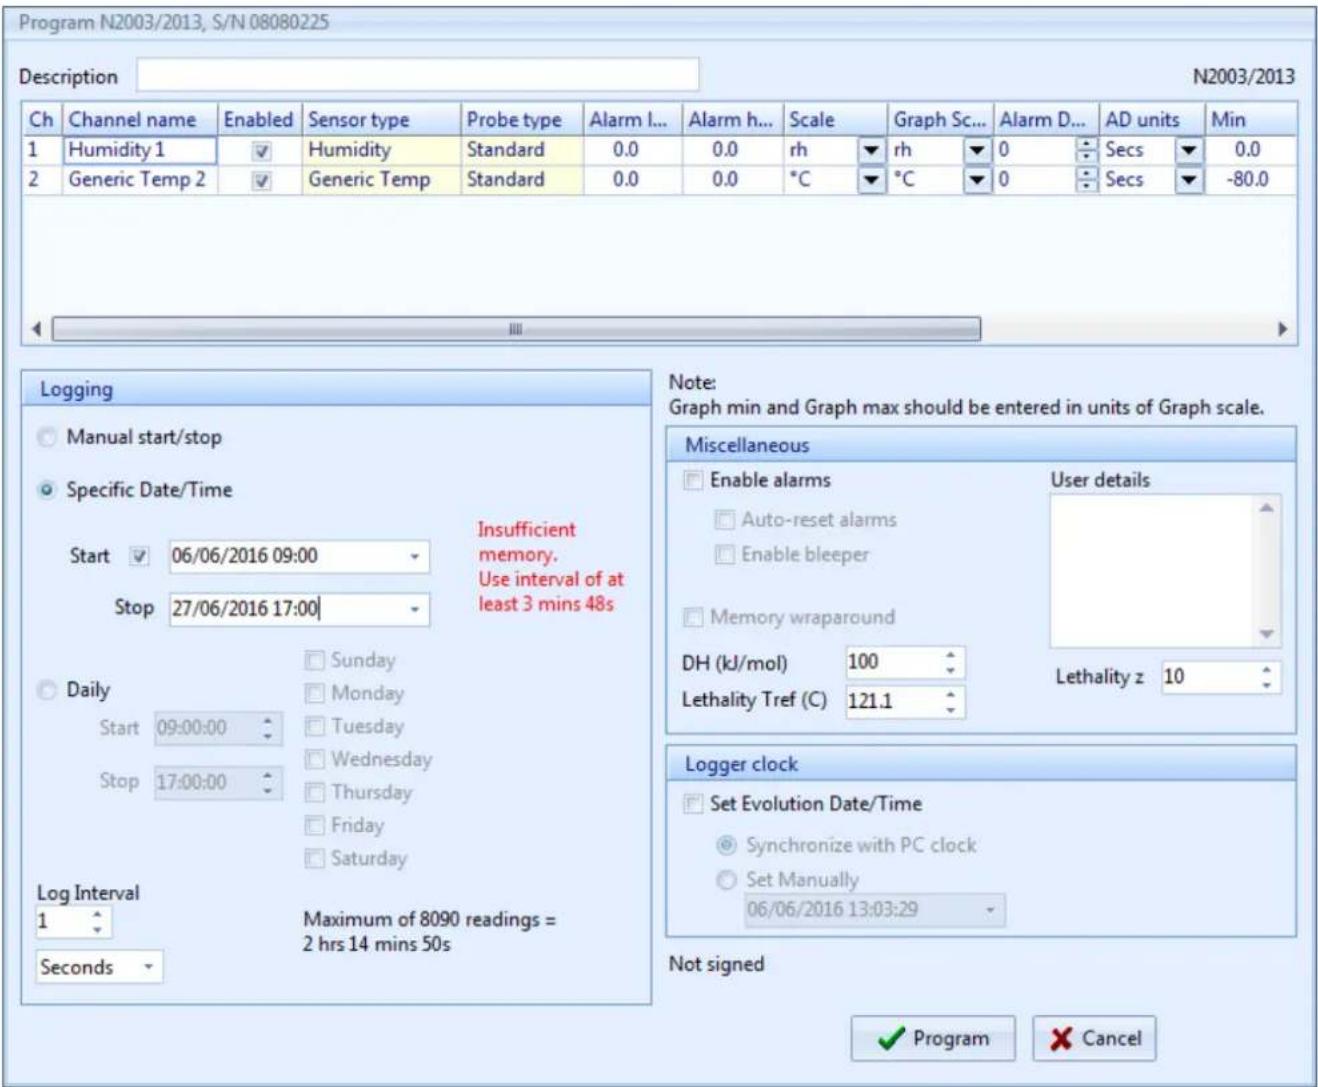
In this next example a med start/stop has been set for a total of 21 Days. It can be seen that the chosen interval is not quite enough to cover all 21 days. We are warned to use a minimum log interval of 3 minutes and 48 seconds to ensure that we have enough memory to cope. In order to cover all 21 days we must set an interval to the nearest minute, in this case 4 minutes would suce.
text_image
Program N2003/2013, S/N 08080225 Description N2003/2013 Ch Channel name Enabled Sensor type Probe type Alarm l... Alarm h... Scale Graph Sc... Alarm D... AD units Min 1 Humidity 1 ✓ Humidity Standard 0.0 0.0 rh ▼rh ▼0 Secs ▼ 0.0 2 Generic Temp 2 ✓ Generic Temp Standard 0.0 0.0 °C ▼°C ▼0 Secs ▼ -80.0 Logging ○ Manual start/stop ● Specific Date/Time Start ✓ 06/06/2016 09:00 Insufficient memory. Use interval of at least 3 mins 48s Stop 27/06/2016 17:00 ○ Daily Start 09:00:00 □ Sunday □ Monday □ Tuesday □ Wednesday □ Thursday □ Friday □ Saturday Log Interval 1 Maximum of 8090 readings = 2 hrs 14 mins 50s Seconds Note: Graph min and Graph max should be entered in units of Graph scale. Miscellaneous Enable alarms User details Auto-reset alarms Enable bleeper Memory wraparound DH (kJ/mol) 100 Lethality z 10 Lethality Tref (C) 121.1 Logger clock Set Evolution Date/Time Synchronize with PC clock Set Manually 06/06/2016 13:03:29 Not signed ✓ Program × CancelMiscellaneous Logging Setup
This secon is perhaps one of the most important as there are a number of seng here to be dealt with.
Enable Alarms
If alarms have been entered into General setup then in order to make use of these then alarms need to be enabled.
Auto Reset alarms can be set. In this mode the alarms will reset when the value drops inside the alarm limits. If this is not set then alarms are deemed to be latched and will stay acvated unl acknowledged, even if the current reading is not in alarm.
Enable bleeper will enable the bleeper where ed.
Memory Wraparound (Not EVt or EV Pro)
In this mode the logger will log indenitely until the logger runs at or is downloaded.
User Details
This is a free form box for the addition of any other applicable notes for the task. These will be stored with the task but will be printed if required with the data.
Mean Kinetic Temperature and Pasteurisation (EV Pro Only)
Please refer to Mean Kinec Temperature for more informaon.
Logging Clock
The Logging Clock secon simply allows for the Clock to be set synchronized to the PC Clock or manually set.
Programming tasks to Loggers
Once a task is written and unless cancelled, clicking on OK will save it to the database for use later.
If quick program was used for generating the task then it is possible to program the logger directly from the task itself.
When a task is programmed to a logger it will automatically be saved if it does not appear in the database already, i.e. it was not an unused task that was nally being used.
Selecting a Task to be programmed to a logger
Using Auto Docking place a logger in the Interface. The soware will automatically recognise it and Iter the task database accordingly.
It is now possible to select anyone of the exisng tasks for the parcular model type in queson. Once selected if the task has been used then it cannot be re-used. However selecng Quick Program will create a new task based on the exisng one, so it can be easily copied.
Any unused task for the logger type can be opened and then programmed to the awaiting logger in the dock.
Once a task has been programmed
Once a task has been programmed to a logger then there are two possible outcomes.
- The logger is set for manual start
- The logger is set for an automac start, with (EVt Only) or without delay (All other models)
Logging Modes
Manual Start/Stop Modes EV and EVt
When a logger has been set for manual start then the logger display will show the word MAN in the lower poron of the LCD. In this case the user must press and hold the navigaon buon on the front of the logger for 6 seconds to start logging.
If manual stop is also selected then the logger will require the same key operaon in order to stop logging.
Delayed Start (EVt Only)
If a delayed start has been programmed then the logger will display 'dLAY' to indicate that it is counting down to the start me once the navigaon buon has been pressed to initiate the programmed task.
Automatic Start/Stop Modes EV and EVt
In the event that either the start and stop are pre-programmed or that automac end is programmed then no further input from the user is required. Simply place the logger where it is to nally log temperature and leave it.
Retrieving Data from EV loggers
When the logger is ready to be downloaded then it must again be acvated using the navigaon buon on the front of the logger and placed face down in the interface (face up for EVt).
If Auto docking is not acve then press the dock Icon in the soware to check dock and download the data.
If Auto docking is acve then the soware will automatically detect the logger and begin the download process, see below:
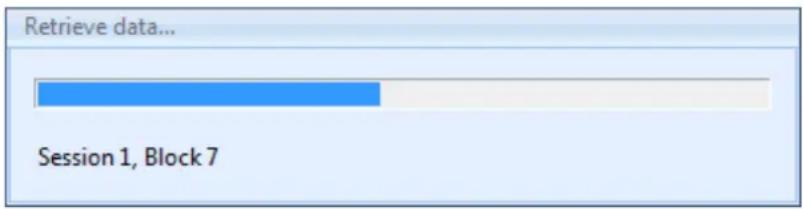
text_image
Retrieve data... Session 1, Block 7When the data has been downloaded the soware will automatically liter the task database, if displayed, for the current logger type and serial number and it will automatically draw the graph with the sengs as in the task.
Note: If the Data Logger is not recognised by the soware then try pressing the buon again to re-activate the logger. If that does not work then click on Auto-Dock to force communicaons to start.
Automatic Time-Zone Correction
The Data Loggers employ Time-Zone Correcon when they are downloaded. This means that the date and me of all data records are adjusted to the Local Time at the point the data is retrieved from the Data Logger to the PC. Therefore if you send loggers across several me-zones, for example transport, then the data will be me and date corrected for the receiver of the Data Logger. It is important however, that a PC used to download the data is programmed with the correct date and me and of course the correct Time-Zone.
Important Note regards EV Pro and 21 CFR Part 11
If a logger is taken and programmed and subsequently downloaded on a PC running the EV Pro soware then it will not then be possible to download the data onto any other PC not running the EV Pro version. Therefore if the logger is to be programmed and sent to another PC for downloading then this PC must also be running the EV Pro version and therefore be running in accordance with the requirements of 21 CFR Part 11.
Please refer to secon Appendix 2 - Title 21 CFR Part 11 for more informaon.
Graphing Data
Once the data has been downloaded then the soware will automacally graph the data for the session just downloaded. There are a number of features within the graphing package that can be explored at this me. These include:
- Adding annotaons
- Graph Title
- Zoom Funcon
• Eding Task Informaon - Changing x-axis readings
- Prinng
• Calculaons of Max, Min, Ave, MKT, Lethality and Pasteurisaon - Copying graph to clipboard
Adding Annotations
From the toolbar for graphing select to add a new note. Move the cursor over the graph and drag it to create a text box. Write your text in the box. Click anywhere else on the graph to complete the process and the box will resize to the amount of text in your box. See example below.
This is a text box for EV Software
By double clicking on the text box it will become acve for eding again. Select all the text then 'A' in the toolbar to change the font type, size and colour, select the colour box below 'A' to select the background colour for the text box. Use the juscaon icons to align the text to the le, centre, or right hand side of the box.
Click outside the box anywhere on the graph to nish.
Click on the select icon then once on the box to select the text box and more opons become available.
Fixed - The box can be ed to a posion in space on the graph, to a line or point on the graph and xed either to the X or Y axis.
Solid/Transparent – The box can be either solid or transparent with regards to the background.
No Line/Line – The box can be shown as being ed to a line on the graph by the addition of a visible line.
Show Text/Show Icon – The text in the box can be shown in full or as an Icon only.
In the example below the text box above has been xed to channel 2, a line has been drawn to a point on channel 2 and the text box has been converted to an Icon.

line
| Time | Value | | ---------- | --------- | | 06:54:10 | 62.5 | | 23/04/2016 | 62.5 | | Alarin high| 60.0 |In the above example this ICON style can be achieved by the following method:
- Select the text box.
- Select Fixed to Channel 1.
- Select Line.
- Drag the line to a posion on the graph.
- Select Show Icon.
When prinng the graph it is possible to select to print the details of the text boxes.
Duplicate notes are also possible where you want to add a quick annoton to another point on the graph. Select the note that you wish to copy then select the duplicate note (s) icon and the note will be copied. If the note is in icon format then they will be numbered sequentially from 1-n. These will be automatically numbered in sequence.
Graph Title
The graph descripon is in the 1^st instance generated by the soware itself in the case that there is neither a task descripon or a session descripon, see example below:
N2003/2013 S/N 06090390 22/04/2016 10:11
If a descripon is entered into the 'descripon' eld of the task itself then this will default to the graph tle. If however a descripon has been added to the session informaon then this will default to the graph tle. See Matrix below for simple explanaon:
| Graph Descripon | Automac | Task Descripon | Session Descripon |
| Task Descripon | None | Yes | Don’t Care |
| Session Descripon | None | None | Yes |
When creang mul-graphs then a tle can be wrien independently of the individual task and session descripons.
Zoom Function
A powerful zoom funcon has been included in the soware, see opons below:
- Zoom Funcon
• Vercal Cursors Graph
• Vercal Cursors Listed Data - Un-zoom
- Zoom and Calculaons
Zoom Function
Click on the magnifying glass icon to acvate zoom. Select a point in space on the graph then drag the magnifying glass across the graph to zoom in. Zooming will be automac when you let go of the mouse.
Vertical Cursors Graph
Select the vercal cursor icon . Use the mouse to posion the 1 ^st vercal cursor then drag the line across the graph to the next point. When you release the mouse the second vercal cursor will be drawn. If Auto Zoom has been cked, see Soware Setup Opons, then the graph will automatically re-draw to the new values.
Vertical Cursors Listed Data
Select the vercal cursor icon . Now select a posion in the listed data to become the 1 ^st line, you can release the mouse at this point. Now scroll down the data to the next point required. Press the CTRL key then select the point in the list. The graph will automatically zoom between the two chosen points.
Un-zoom

Select the un-zoom or graph reset icon to re-draw the graph.
Zoom and Calculations
If zoom is acve then the calculaons funcon will work on the selected data only.
Calculations
There are powerful calculaon funcons within the EV package.
Select the poron of data that you wish to perform the calculaons on using zoom above or un-zoom to perform the
calculaons on the whole le. Select the calculaons Icon to perform the calculaons. The soware will display the results as follows:

text_image
Statistics Channel Start/V1 value at 19:11-30am Apr... End/V2 value at 7:01-30am Apr 24 Minimum Maximum Average Std Dev. MRT [CHs... Slope [V/s] Letality equivalent time [Tefs: 121.1°C, to 18... Below Alarm Low Above Alarm High Ch1 = Humidity (μH) 60.2 61.5 56.4 (10:11:50am Apr 22 66.1 (700.8pm Apr 22 68.38 1.177 N/A 0.5495E-008 N/A 0x 10:17K 8m0s Ch2 = Genetic Temp (°C) 15.5 12.9 12.5 (5:27:50am Apr 24) 15.5 (10:11:50am Apr 22 13.21 0.74458 13.75 -1.600E-005 0x 0x 8c Disposed time = 20s, 4 readings with interval of 5 Export CSV OKThe stascs include the following informaon:
- Date Time of 1^st reading used including its value (typically the 1^st reading in the session)
- Date Time of the last reading used including its value (typically last reading in the session)
• Minimum recorded reading between the two mes above
• Maximum recorded reading between the two mes above - Standard deviation of the readings between the two mes above
• Mean Kinec temperature between the two mes above and using the values entered in the Task - Slope reading
- Lethality equivalent me based on the values entered in the Task
Elapsed me is also included so that it can be clear for how long the readings apply, including the number of logged readings and the logging interval.
These readings can now be exported to a CSV le for report generaon or prinng.
Creating Multi-Graphs
It is possible with the EV soware to create a Mul-Graph. This consists of a number of graphs overlaid on top of each other to form another graph. There is no limit to the number of graphs that can be overlaid on each other. Graphs can also be overlaid for dierent logger types.
To create a mul-graph switch to Task Database view or Split Screen.

Select the Mul-graph Icon and the following screen will be displayed:

text_image
XV Technical (STC) File Home Edit Tasks Program Multiple session graph Task database Filter tasks Graph New multi graph Quick program Dock (Auto) Split screen Clear Screen Reset graph Print Copy to clipboard Calculate Statistics User Guide Display Tools A. Font Background color Duplicate note(s) Set text left Fixed Solid Line Show Icon Rel Abs Readings Bottom aid Ta... Description... Model Serial ... Created date/time Data start date/time Data end date/time Channels Days Alarm Session Description Start date/time End date/time Total records 1 20001/2011 09090239 06/06/2016 10:31 21/07/2010 14:32 21/07/2010 14:32 1 20003/2013 08090390 06/06/2016 11:06 22/04/2016 10:11 24/04/2016 07:03 1,2 High 20003/2013 08080225 06/06/2016 11:38 26/07/2009 16:51 26/07/2009 21:10 1,2 Multiple session graph Description Multi-Graph Task ID Description Session ... Ch no... Model Serial no. Data start date/time Data end date/time Channels 1 1 N2001/2011 09090239 21/07/2010 14:32:35 21/07/2010 14:12:35 1 2 N2003/2013 08090390 22/04/2016 10:11:50 24/04/2016 07:03:30 1,2 3 N2003/2013 08090225 26/07/2009 16:51:39 26/07/2009 21:10:56 1,2 Add selected sessions Remove Cancel OK Graph Not filtered, sorted by Task ID, Created date/timeSee EVSW Database for an explanaon of the task database view.
At this point it is possible to select tasks and therefore sessions to be added to the mul-graph. Simply select the sessions that you want to add the click 'Add selected sessions'. If the sessions have graphs associated with them that include channel notes then ck 'Ch notes' and these notes will be copied to the mul-graph. When all the sessions have been selected click on 'Graph' to save and graph the new mul-graph or simply 'OK' to save for later.
To view old mul-graphs select 'Mulple session graph' then either;

Select mul graph by Task... and the soware will display a list of Mul-Graphs containing this Task

Select mul graph by serial number...and the soware will display a list of Mul-Graphs containing the logger with the current serial number.
Select mul graph by model...and the soware will display a list of Mul-Graphs containing this logger type.
Show last mul graph to display the last Mul-Graph.
Printing
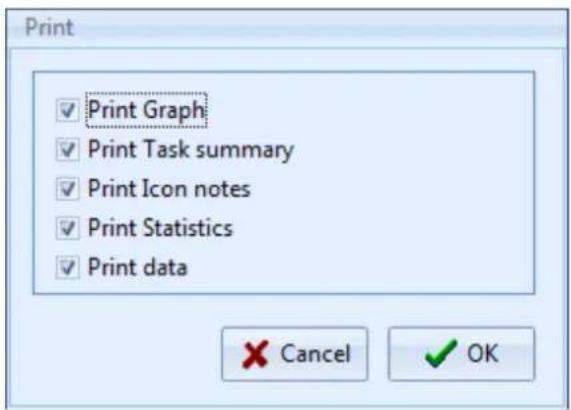
Data from the graph can be printed in a number of ways. From the graph select the print Icon and the following selecon will be oered:
text_image
Print ✓ Print Graph ✓ Print Task summary ✓ Print Icon notes ✓ Print Statistics ✓ Print data Cancel ✓ OKHere there are opons for Prinng the graph, task summary, Icon notes, or the data, in any combinaon.
The graph will be printed as per the selecon made in opons, see secon Soware Setup Opons.
EVSW Database
Database Description
All the tasks for all the loggers known to the soware and all the session informaon is stored in the database.
Select Task Database or Split Screen Icon to view the database.
The database is split into two seconds. On the le are all the tasks and on the right is the session informaon. When a logger is downloaded and informaon stored this creates a new session. Depending on how the logger was used will determine the number of sessions created or indeed possible per task.
If a logger in manual start stop mode is started and stopped many mes but not downloaded then each block of data will create a new session of data. If the logger has not logged to full then the task will not be closed and the logger can be started again.
If a logger logs connuously until full it will stop, wraparound 0, then the task will be completed when the data is downloaded. The data will be either, a single block and therefore a single session, or if it has been stopped and started again then mulple sessions are possible. To use the logger again will require a new task to be created.
If a logger logs automatically from me X to me Y then the task will be closed when the logger is downloaded and a single session will be created.
If a logger is logging on daily logging mode and has logged to full then the task will be closed. If the logger has logged for more than one day then each day will become a session of data.
Editing Tasks/Sessions
Aer a task has been created it can only delete if it has not been programmed into a logger. Once it has been used it cannot be deleted, only archived.
However certain elements of the task can be edited aer the task has been written and data has or has not been downloaded.
These include:
- Descripon
- Graph Scale
- Graph Max and Min
• Graph Line Colour and Line Width
• MKT/Lethality and Pasteurisaon Values
None of these will act the downloaded data simply the way that it is presented and how some of the calculations are performed on the data.
Eding sessions includes only adding/changing the session descripon.
Task Useful Information
The tasks include useful summary informaon about the data aer it has been downloaded. This informaon includes:
- Descripon
- Model
- Serial Number
- Created Date/Time
• Data Start Date/Time - Date End Date/Time
- Channel Summary
• Daily Days Summary - Alarm Summary
• Created By (EV Pro Only) - Modied Date/Time (EV Pro Only)
- Modied By (EV Pro Only)
• *External Task Yes/No (EV Pro Only)
*If a data logger is introduced to the system that has not been programmed with the same PC and therefore does not have a task associated with it then the data will be downloaded in any case but the task will be re-created by the soware from data in the logger. This task will be marked as being 'External' so as to identify that it was not created on this PC.
Filtering/Sorting Tasks/Sessions EV Standard version
Select 'Task Filter' Icon to enter the task Iter opons. The following dialog box will be displayed;
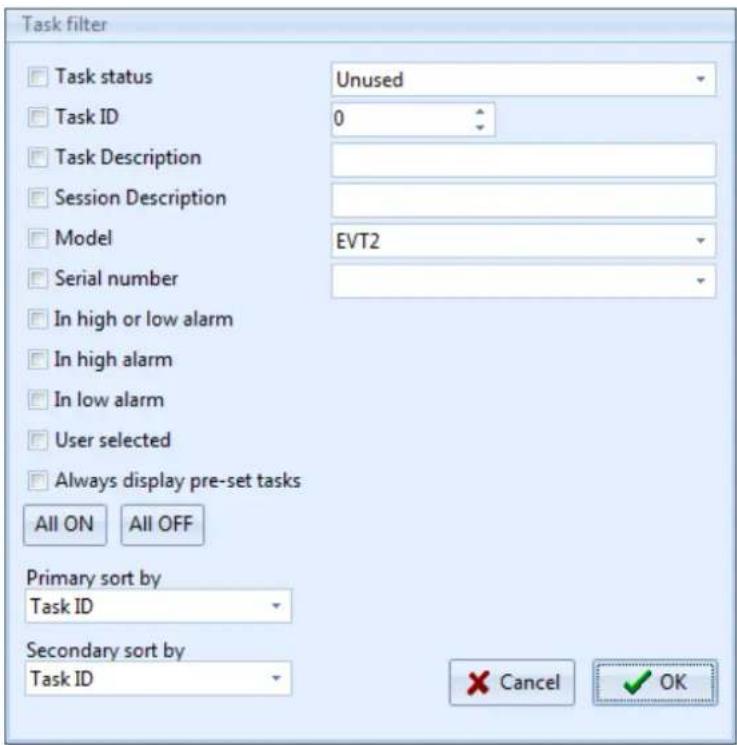
text_image
Task filter □ Task status Unused □ Task ID 0 □ Task Description □ Session Description □ Model EVT2 □ Serial number □ In high or low alarm □ In high alarm □ In low alarm □ User selected □ Always display pre-set tasks All ON All OFF Primary sort by Task ID Secondary sort by Task ID × Cancel ✓ OKAt this point it is possible to liter and sort the task database view using a number of dierent Iters.
Task Status
The tasks will be Itered by one of three opons; Unused, Acve and Closed.
Task ID
You can liter out all but a specific task in the database.
Task Description
Use this Iter to Iter out tasks with a specific descripon or one that contains a word or phrase.
Session Description
Use this Iter to Iter out tasks with a specific session descripon or one that contains a word of phrase.
Model
Use this Iter to show only those tasks that apply to a particular model type.
Serial Number
Show all the tasks for a particular logger serial number, i.e. a specific individual logger.
In High or Low alarm
Filter the tasks to show only those with readings in either high or low alarms.
In High Alarm
Filter the tasks to show those with readings in high alarm.
In Low Alarm
Filter the tasks to show those with readings in Low Alarm.
User Selected
Use the ck boxes on the tasks to select individual tasks or groups of tasks. When you have subsequently iterated by these tasks it is then possible to archive these individual tasks by selecng 'File - Archive Visible Tasks'. In this way individual tasks no longer required can be removed from the database.
Always Display pre-set Tasks
If Ticked then the Database view will be Itered to the Tasks Manually Ticked as 'pre-set'.
Primary Sort/Secondary Sort
The results can be sorted by;
- Task ID
- Task Descripon
- Generic Model
- Serial No
- Date start date/me
- Date end date/me
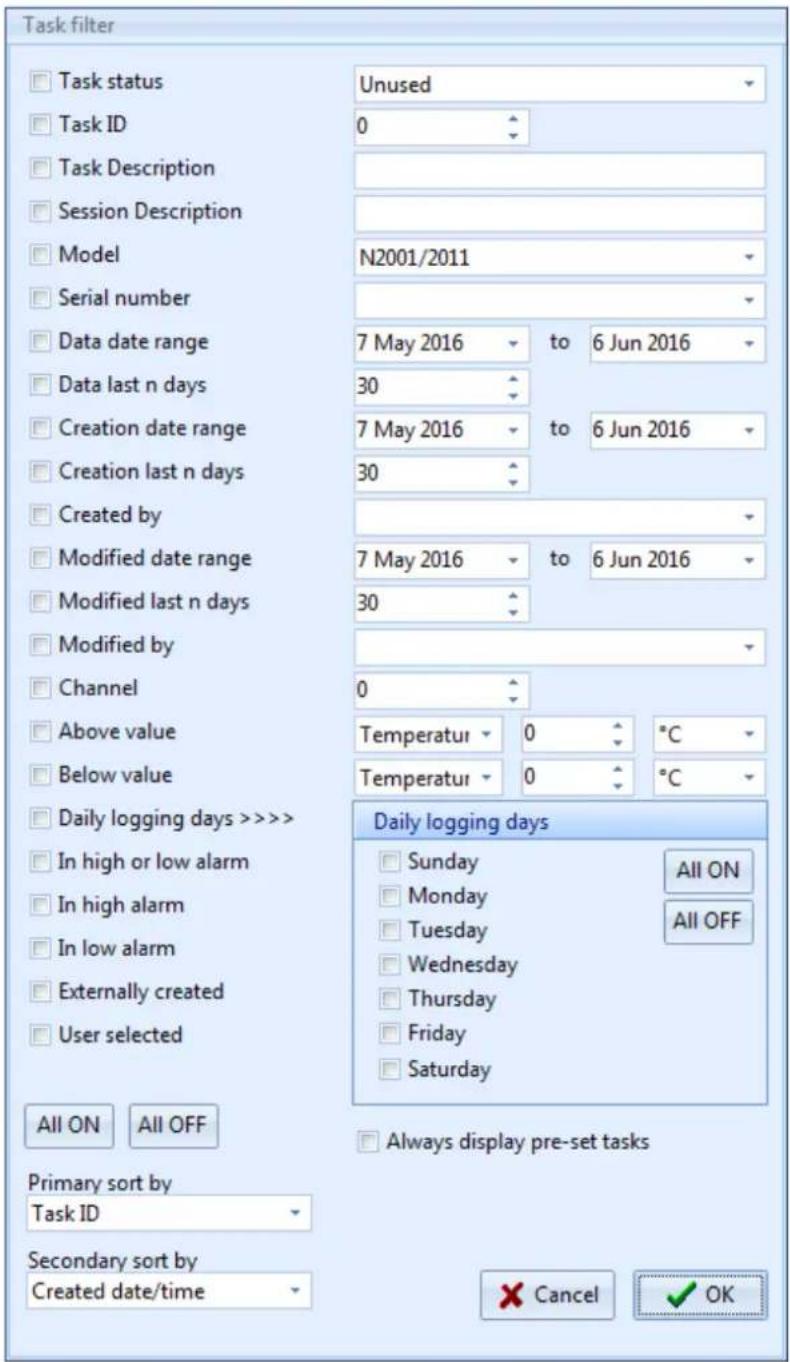
text_image
Task filter □ Task status Unused □ Task ID 0 □ Task Description □ Session Description □ Model N2001/2011 □ Serial number □ Data date range 7 May 2016 to 6 Jun 2016 □ Data last n days 30 □ Creation date range 7 May 2016 to 6 Jun 2016 □ Creation last n days 30 □ Created by □ Modified date range 7 May 2016 to 6 Jun 2016 □ Modified last n days 30 □ Modified by □ Channel 0 □ Above value Temperatur 0 °C □ Below value Temperatur 0 °C □ Daily logging days >>>> □ In high or low alarm □ In high alarm □ In low alarm □ Externally created □ User selected All ON All OFF Primary sort by Task ID Secondary sort by Created date/time Daily logging days □ Sunday All ON □ Monday All OFF □ Tuesday □ Wednesday □ Thursday □ Friday □ Saturday □ Always display pre-set tasks × Cancel ✓ OKAt this point it is possible to liter and sort the task database view using an expanded number of Iters over the standard version:
Status Filter
The tasks will be Itered by one of three opons; Unused, Acve and Closed.
Task ID
You can liter out all but a specific task in the database.
Task Description
Use this Iter to Iter out tasks with a specific descripon or one that contains a word or phrase.
Session Description
Use this Iter to Iter out tasks with a specific session descripon or one that contains a word of phrase.
Model
Use this Iter to show only those tasks that apply to a parcular model type.
Serial Number
Show all the tasks for a parcular logger serial number, i.e. a specific individual logger.
Data Date Range
It is possible to liter the tasks by data date range too and from by entering two dates.
Data last n Days
Filter by the most recently downloaded data.
Creation Date Range
Filter tasks by created date range by entering two dates to and from.
Creation Last n days
Filter tasks by the most recently created.
Created By
Filter tasks by Users/Administrators who have created them.
Modified Date Range
Filter tasks by when they were modified by selecng to and from date range.
Modified last n days
Filter tasks by those modified most recently.
Modified By
Filter tasks by User/Administrator who modified them.
Channel
Filter tasks by those with a certain acve channel.
Above Value
Filter Tasks/Sessions by those with a value above a certain value, freely selectable type, value and scale.
Below Value
Filter Tasks/Sessions by those with a value below a certain value, freely selectable type, value and scale.
Daily Logging Days
Filter tasks by those with daily logging days, freely selectable days.
In High or Low alarm
Filter the tasks to show only those with readings in either high or low alarms.
In High Alarm
Filter the tasks to show those with readings in high alarm.
In Low Alarm
Filter the tasks to show those with readings in Low Alarm.
Externally Created
Filter tasks that were originally not generated on the current PC.
User Selected
Use the ck boxes on the tasks to select individual tasks or groups of tasks. When you have subsequently iterated by these tasks it is then possible to archive these individual tasks by selecng 'File - Archive Visible Tasks'. In this way individual tasks no longer required can be removed from the database.
Primary Sort/Secondary Sort
The results can be sorted by;
- Task ID
- Task Descripon
- Generic Model
- Serial No
- Date start date/me
- Date end date/me
General Task Management
There are a number of Task funcons available to the user as part of the management of the database.
Delete Tasks

Delete All Visible Unused Tasks – Any visible task, aer task ltering, that has not been used to collect any data can be deleted.

Delete All Visible Tasks – Standard Soware Only – Any visible task, after task ltering can be deleted.
Create New Tasks

Create New Task from Current Task – Create a new task from the current selected task, the current sengs will be duplicated.

text_image
Create new task based on selected modelCreate New Task based on selected model – Create a new blank task for a specific Logger Model, select from list.
Filter Tasks

Filter tasks
Filter Task – Brings up the current Task Filter, see Filtering Tasks EVSW or Filtering Tasks EVSWPRO

Filter as current task model and serial no.
Filter as current task model and serial no – Filter by current selected model and serial number to see all tasks for this specific logger

Clear filter
Clear Filter – Clear Iter to return to un-Itered database
Editing Visible Task Columns
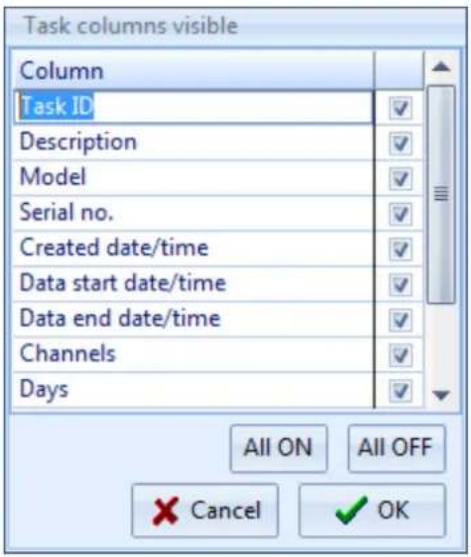
Selecng Eding Visible Task Columns brings up this Window...
text_image
Task columns visible Column Task ID Description Model Serial no. Created date/time Data start date/time Data end date/time Channels Days All ON All OFF Cancel OKHere you can remove columns that you do not use. Make your selecon and then click OK to conrm.
Filter Re-call
It is possible to re-call a previously used Filter without the need to set up the Iter again.
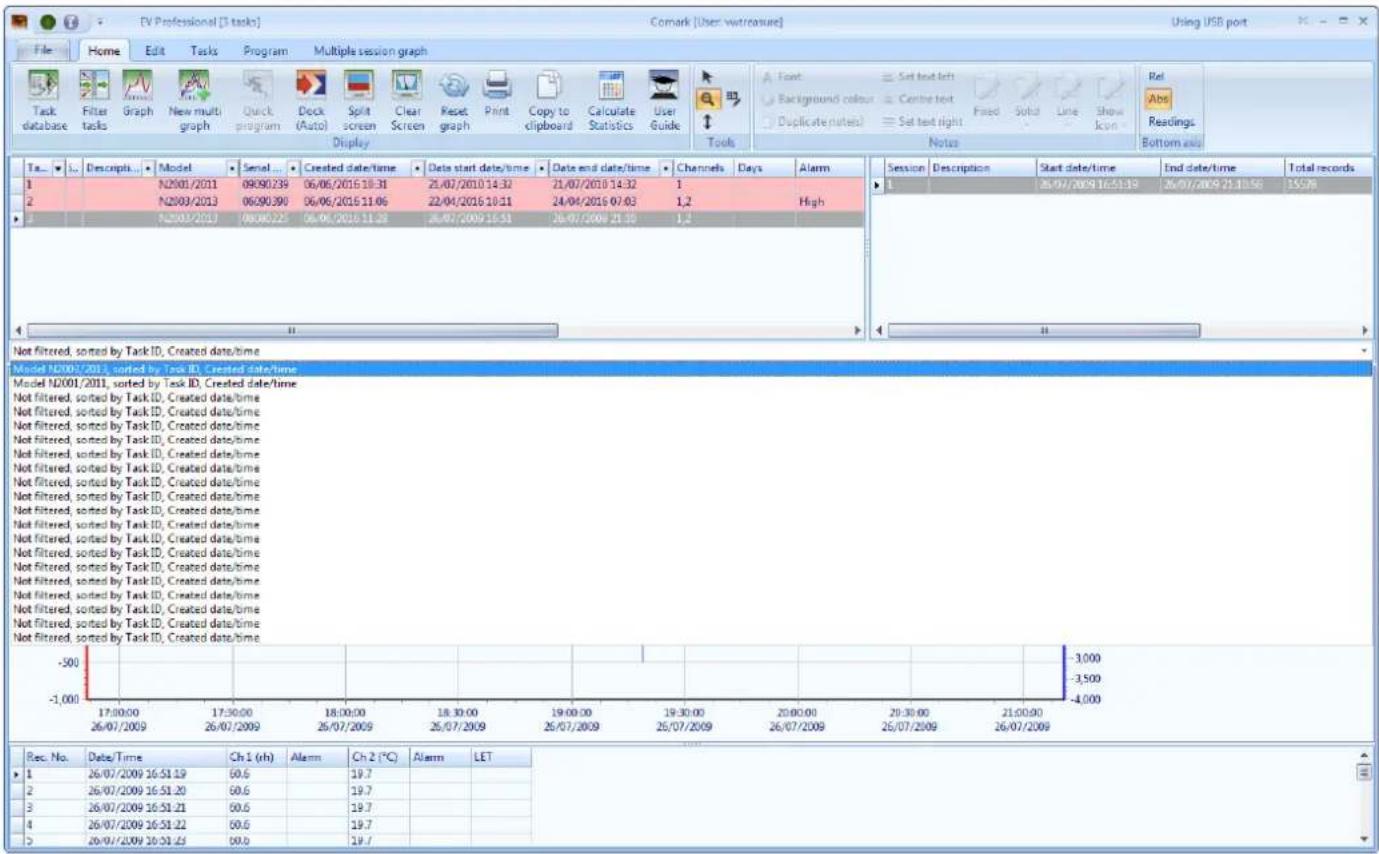
From the Task Database view or the split screen view click on the drop down menu at the boom of the task database list to reveal the last used Filters. See example below:
text_image
EV Professional [3 tasks] Comark [User: vitreasure] Using USB port File Home Edit Tasks Program Multiple session graph Task database Filter tasks Graph New multi graph Quick program Dock (Auto) Split screen Clear Screen Reset graph Print Copy to clipboard Calculate Statistics User Guide Tools Actions Set text left Background colour Centre text Duplicate notes) Set text right Fixed Solid Line Show Icon Rel Abs Readings Bottom axis Ta... ... Descriptions... Model Serial ... Created date/time Date start date/time Date end date/time Channels Days Alarm Session Description Start date/time End date/time Total records 1 N2001/2011 09:00:239 06/06/2015 18:31 21/07/2010 14:32 21/07/2018 14:32 1 2 N2003/2013 06:00:390 06/06/2015 11:06 22/04/2016 10:11 24/04/2016 07:03 1,2 High N2002/2013 08:06:225 06/06/2016 11:28 26/07/2009 15:31 26/07/2009 21:30 1,2 Not filtered, sorted by Task ID, Created date/time Model N2007/2013, sorted by Task ID. Created date/time Model N2001/2013, sorted by Task ID. Created date/time Not filtered, sorted by Task ID. Created date/time Not filtered, sorted by Task ID. Created date/time Not filtered, sorted by Task ID. Created date/time Not filtered, sorted by Task ID. Created date/time Not filtered, sorted by Task ID. Created date/time Not filtered, sorted by Task ID. Created date/time Not filtered, sorted by Task ID. Created date/time Not filtered, sorted by Task ID. Created date/time Not filtered, sorted by Work ID. Created date/time Not filtered, sorted by Task ID. Created date/time Not filtered, sorted by Task ID. Created date/time -500 -3,000 -1,000 -3,500 -4,000 Rec. No. Date/Time Ch 1 (rh) Alarm Ch 2 (°C) Alarm LET 1 26/07/2009 16:51:19 60.6 19.7 2 26/07/2009 16:51:20 60.6 19.7 3 26/07/2009 16:51:21 60.6 19.7 4 26/07/2009 16:51:22 60.6 19.7 5 26/07/2009 16:51:23 60.6 19.7It is possible therefore to set up a number of favourite Iters which can then be re-called at any me without the need to set them up again.
Audit Trail EVSW PRO Only
The EVSW PRO soware has an Audit Trail in order to be compliant with 21 CFR part 11. This secon explains how to access and use the Audit Trail.
Open Audit Trail
Select File-View-Print Audit Trail and the Audit Trail Window will open.
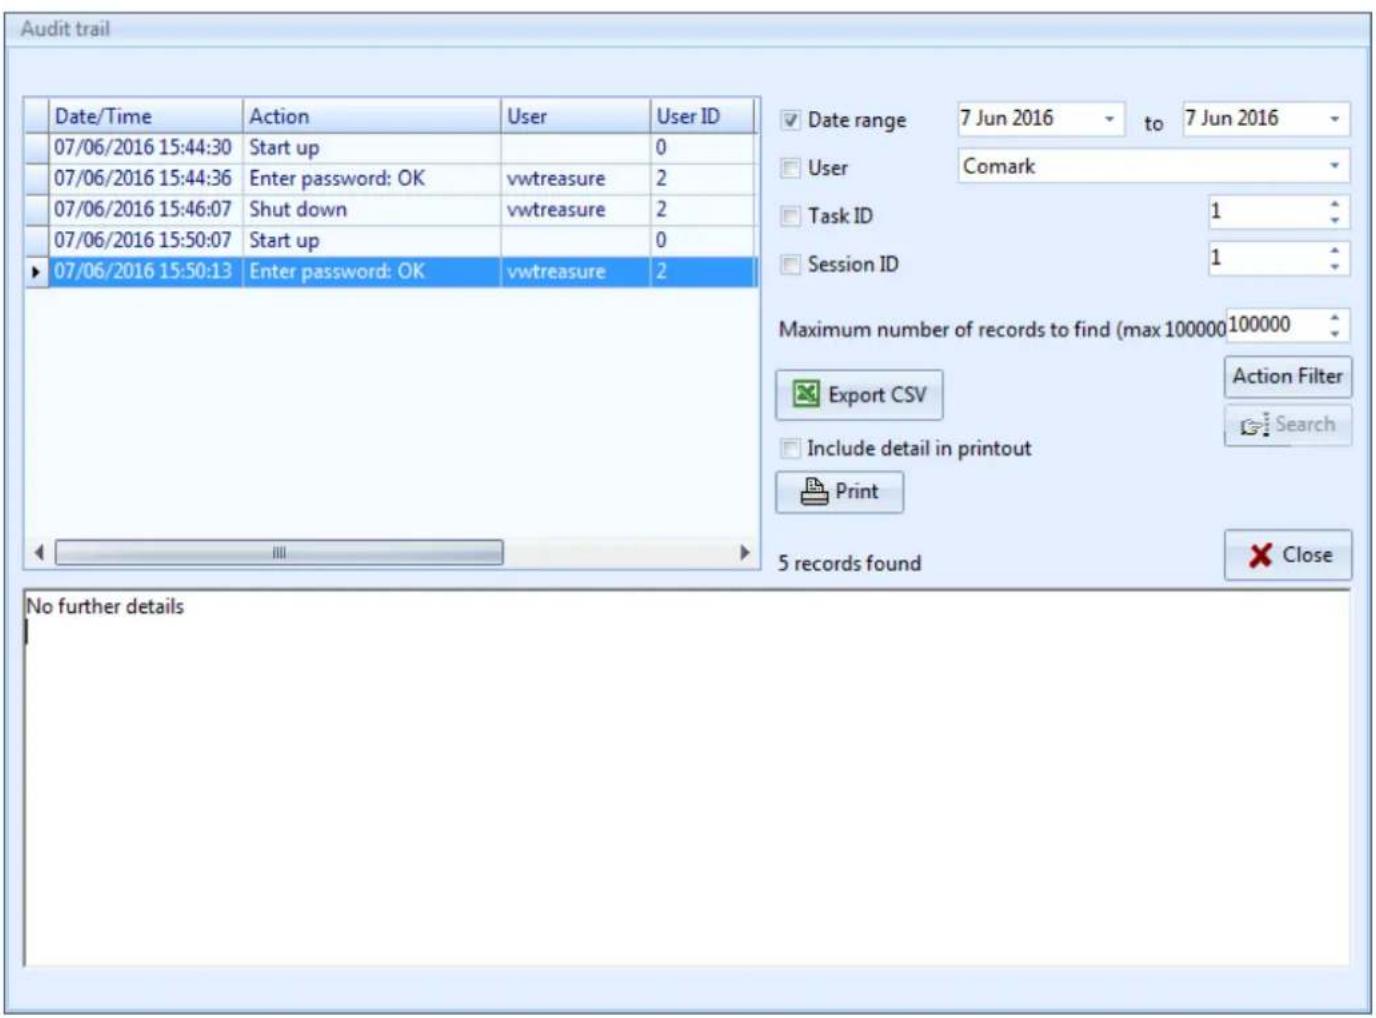
text_image
Audit trail Date/Time Action User User ID 07/06/2016 15:44:30 Start up 0 07/06/2016 15:44:36 Enter password: OK vwtreasure 2 07/06/2016 15:46:07 Shut down vwtreasure 2 07/06/2016 15:50:07 Start up 0 07/06/2016 15:50:13 Enter password: OK vwtreasure 2 Date range 7 Jun 2016 to 7 Jun 2016 User Comark Task ID 1 Session ID 1 Maximum number of records to find (max 100000 100000 Export CSV Action Filter Include detail in printout Print 5 records found Close No further detailsThere are a number of useful tools here:
Top le of the Window will be the Audit Trail for today, showing all Soware acvity for today.
If there are any additional details pertaining to the acon recorded these will appear in the Window below.
Across to the right hand side of the Window there are other Filter Opons...
- Date Range – Select to and from Dates to display
- User – Tick the Box and then select the User results you want to view
- Task ID – Tick the box and then select the Task ID that you are interested in
- Session ID – Tick the box and then select the Session ID that you are interested in
If you wish to restrict the maximum number of records to be displayed, please use the drop down.
Select the Acon Filter to Iter the results by Acon
When ready Click on Search to Iter the Audit Trail as per your sengs.
It is possible at this point to export the Audit Trail to a CSV le for reporg and it is possible also to Print the Audit Trail if necessary, with or without the details.
When you are nished simple press Close to exit.
The Audit Trail is updated whenever you complete acons in the soware, such as programming Data Loggers. It is not possible to edit or alter the records in the Audit Trail.
Signing Tasks - EVSW PRO Only
When a Task is complete and data recorded, it is possible to Sign that Data for record purposes and to conrm that the data is true.
Signing Data is a straighorward process. Simply select the Task you wish to Sign (Tasks along with all Session Data will be signed together. It is not possible to sign o one single session), then select Tasks-Sign Task to bring up this screen....

text_image
Sign Task - Enter password User vwtreasure Password ****** Exit EV Professional OKEnter your password and Click OK to connue.
You must now provide your Authority for Signing Data and the reason for signing the data....
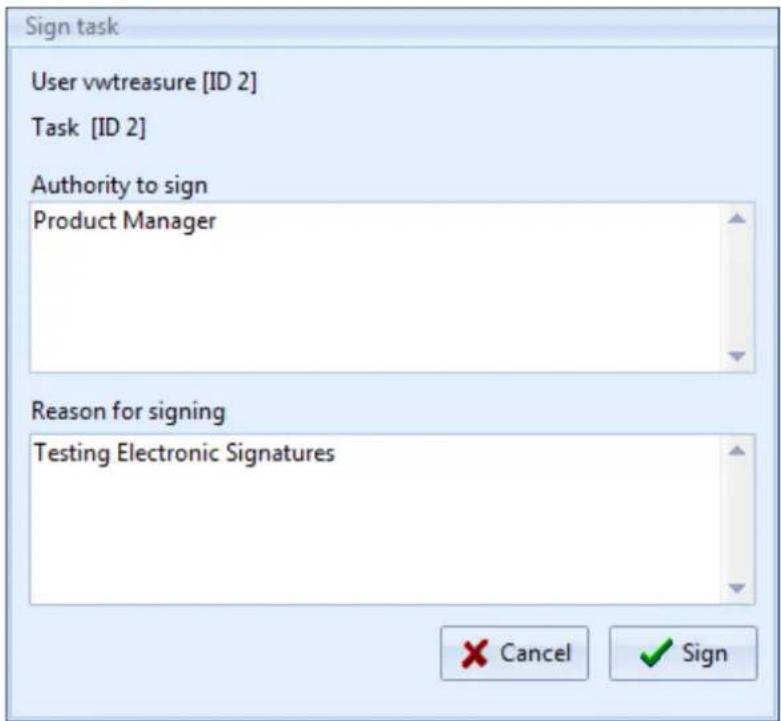
text_image
Sign task User vwtreasure [ID 2] Task [ID 2] Authority to sign Product Manager Reason for signing Testing Electronic Signatures Cancel SignClick Sign to complete the process.
Once signed the Task will have a Key Symbol in the Signed Column of the Database.

text_image
Ta... ✓ Signed 1 2 3Appendix 1 - Mean Kinetic Temperature/Lethality/Pasteurisation (EV Pro Only)
It is possible via the task set up to enter values for:
• Mean Kinec Temperature
- Lethality
- Pasteurisaon
In the EVPro version of EV sware only.
The values entered are used to create the values for Mean Kinec Temperature/Lethality and Pasteurisaon as shown in the Calculaons feature of graphing. See Graphing Data.
Mean Kinetic Temperature (MKT)
Good warehousing and distribuon pracce requires that warehouse temperatures are monitored and controlled and that appropriate acons are taken if temperatures exceed the specied storage conditions.
Those acons are based on the calculaon of the mean kinec temperature as a vericaon of exceeded storage conditions.
With the EV Pro soware from Comark it is now possible to calculate the mean kinec temperature (MKT).
The Internaonal Conference on Harmonisaon of Technical Requirements for Registraon of Pharmaceutics for Human Use (ICH) stability tesng guidelines dene mean kinec temperature (MKT) as 'a single derived temperature which, if maintained over a dened period, would aord the same thermal challenge to a pharmaceutical product as would have been experienced over a range of both higher and lower temperatures for an equivalent dened period'. In other words, MKT is a calculated, xed temperature that simulates the eects of temperature variaons over a period of me. It expresses the cumulative thermal stress experienced by a product at varying temperatures during storage and distribuon. Mean kinec temperature refers to a datum, which can be calculated from a series of temperatures. It diers from other means (such as a simple numerical average or arithmec mean) in that higher temperatures are given greater weight in compung the average. This weighing is determined by a geometric transformaon, the natural logarithm of the temperature number. Disproportionate weighing of higher temperature in a temperature series according to the MKT recognises the accelerated rate of thermal degradaon of materials at these higher temperatures.
MKT accommodates this non-linear eect of temperature.
The formula for MKT is: TK[K] = (-DH / R) / (SUM (exp (-DH / (R * Tn)))) / n where DH is the acvaon energy, R is the universal gas constant (0.0083144 kJ/molK), T is the temperature in degrees K, n is the total number of (equal) time periods over which data are collected, ln is the natural log and exp is the natural log base. SUM is the mathematical function of building up a total over n periods, starng with period 1.
The praccal applicaon of the equaon is less complex than it rst appears. For a huge range of pharmaceucs DH is within the range of 42 - 125 kJ/mol. In cases where an exact knowledge of the acvaon energy is important, it is possible to determine this factor with the help of a dierenal scanning calorimetry (DSC) analysis. T1 is the average temperature recorded over the rst me period and Tn is the average temperature recorded over the nth me period.
As an example of how the MKT calculaon will aect an expressed mean for a calculaon (important for the long
term storage of crical drugs and chemicals), here is an illustraon. If the temperature is constant for a period of me, but is 'out of specs' for some moments of me, there will be a dience in the calculated arithmec mean (the sum of all of the measurements divided by the number of measurements - a simple mean) and the kinec mean. Mean kinec temperature: value = 9.4C Arithmec mean temperature: value = 6.3C Conclusion : Depending on temperature condions the eect may be dramac, it is clear that the MKT method weights the higher temperatures in a series more than the lower temperatures.
This is a more appropriate way of calculang an overall thermal eect because of the acceleraon of thermally driven processes of degradaon at higher temperatures.
Ageing a secondary calculaon is used to determine the shelf life reducon due to incorrect storage conditions of a drug sub-stance or drug product. The formula for this calculaon is based on the Arrhenius2 life-stress model. Not included with EV Pro.
Example: Due to the incorrect treatment during the unloading of a pharmaceutical product, its shelf life has been dramatically reduced from ten days down to 4.3 days.
If the channel does not read in temperature then the result will be shown as 'N/A'.
Lethality
Lethality equivalent me is calculated using the formula:
$$ \text { LET } = (\text { SUM } (1 0 ^ {\wedge} ((\text { Tn - Tref }) / Z))) ^ {*} \text { Tinc } $$
- Tn is a reading in temperature in Celsius
- Tref is the reference temperature in Celsius
• Z is a constant just known as the 'Z value' - Tinc is the reading me increment in seconds
- Tref and Z are entered on task setup form.
Standard lethality (Fo) uses Tref = 121.1°C and Z = 10
These are the default values in the setup used by EV, but can be changed at any me.
Pasteurisation
The above lethality formula is well known in the food industry, however specific values of Tref and Z must be set up. Z varies according to the organism that you are trying to kill, see Appendix 1 for a list of some of the more common ones.
Appendix 2 - Title 21 CFR Part 11
What is 21 CFR Part 11?
The FDA (Food and Drug Administraon) in the USA, issued regulaons Title 21 CFR (Code of Federal Regulaons) Part 11 that provide criteria for acceptance by FDA or an approved regulatory body, for the acceptance of electronic records, electronic signatures, and handwrien signatures executed to electronic records as equivalent to paper records and handwrien signatures executed on paper. These regulaons, which apply to all FDA program areas, are intended to permit the widest possible use of electronic technology, compatible with the FDA's responsibility to promote and protect public health. Part 11 applies to any record governed by an exisng FDA predicate rule that is created, modified, maintained, archived, retrieved, or transmied using computers and/or saved on durable storage media. In other words any record from a data logger for instance that is at some stage stored on a PC or where a PC is used to retrieve the data, 21 CFR Part 11 can be applied.
Title 21 CFR Deinitions
Electronic Record
Any combinaon of text, graphics, data, audio, pictorial or other informaon representaon in digital form, that is created, modified, maintained, archived, retrieved or distributed by a computer system.
Electronic Signature
A computer data compilaon of any symbol or series of symbols, executed, adopted or authorised by an individual to be legally binding equivalent of the individual's handwrien signature.
Digital Signature
An electronic signature based upon cryptographic methods or originator authencaon, computed by using a set of rules and a set of parameters such that the identity of the signer and the integrity of the data can be veried.
Closed System
An environment in which system access is controlled by persons who are responsible for the content of electronic records that is on the system.
Open System
An environment in which system access is not controlled by persons who are responsible for the content of electronic records that is on the system.
Standard Operating Procedures (SOP's)
Guidelines and rules denied by the organisaon implementing Title 21 CFR Part11 compliance to instruct users what they are and are not permitted to do and how they are to perform the relevant tasks.
Diligence EV Professional Software
The Diligence EV Professional Soware includes a number of sengs and data protecon devices that along with the EV and EVt series of data loggers will give the user a compliant system if adopted into their SOP's. The soware can control the access to areas of the soware by individual user by means of Administrators who can set up and allocate individual users with their own unique access levels to the soware. However it is always the organisaon's responsibility to make sure that any parcular user is responsible and understands that any document he/she signs using this soware under a 21 CFR environment is the equivalent of a handwrien signature.
Electronic Signatures
Electronic Signatures can now be added to tasks in the database. The electronic signature can only be added by users with the specific funcon allowed in their prole and contains all the required elements, name, date, me, reason for signing and authority to sign.
Audit Trails
Along with Electronic Signatures a full audit trail has been included with the soware that gives a record of all the advies on the workstaon by those users who have logged into the EV PRO soware. Vital for record keeping in a 21 CFR Part 11 environments.
21 CFR Part 11 Policy Statement
Comark does not at any me imply that the use of this soware package and Comark EV loggers that this will automacally give the customer protecon and compliance with 21 CFR Part 11. The FDA is very strict on this. The EV Pro soware from Comark is designed to be integrated into the SOPs as part of a 21 CFR Part 11 system. A number of tools have been put into place in order to provide an excellent basis for complying with the requirements of 21 CFR Part 11. If the SOPs are updated to include the use of EV Pro soware and loggers then compliance is not guaranteed but it will be more likely. In any case the system in place will need to be discussed with an FDA Auditor. EV Pro and EV data loggers are a vital link in the path to compliance.
21 CFR Part 11 restrictions
In order for the EV Pro soware to be used in a 21 CFR Compliant system there are a couple of restricons over the EV standard version.
The Wraparound funcon within the task has been removed. In that way it is not possible to allow the logger to connue logging and over write exisng data. If the memory capacity of an individual logger is not acceptable then the log interval should be increased to cover the full period.
Loggers that are used with the EV Pro version will lose their compatibility with the Standard version and older versions of Evoluon soware where applicable.
Appendix 3 - EV and EV Pro Differences
The EV and EV Pro soware have been developed in conjuncon with several leading pharmaceutical companies to react their needs with the demands of 21 CFR Part 11 in parcular.
Both versions of the soware include the same new user interface to make programming and downloading of EV loggers even easier. Extensive reporting and iterating funcons have made it easier for the user to see what's happening with his/her data and the additional of the Audit Trail, required for 21 CFR Part 11, EV Pro Only, enables full and paral history of who did what when and where.
The format of the soware has removed the need for le open, and le save as all data is stored in one secure database. The screen layouts have been improved to include the task, graph, session data and listed data all in the one place for easy idencaon.
Possibly the most noceable feature of the new soware is the automac download, simply acvate the logger and place it on the cradle and let the soware do the rest. Hidden in the background are improvements to both the download speed of the logger and safeguards to protect the logger from tampering. Hidden from view but nonetheless important addions.
Each task can now be signed electronically again to meet the requirements of 21 CFR Part 11 but will also nd many uses in other logging environments, EV Pro Only.
The following list is a non-exclusive list Z values for some of the more common organisms used in the calculaon of Pasteurisaon:
• Enterococcus Faecalis (6.7)
• Staphylococus aureus (4.6)
• Salmonella seenberg (5.7)
• Lactobacillus plantarum (12.5)
• Listeria monocytogenes (6.7)
• Clostridium boulinum non-proteolyc B (9.7)
• Clostridium boulinum non-proteolyc E (9.4)
• Clostridium butyricum (8.3)
- Byssochlamys fulva (7.8)
• Zygosaccharomyces bailii (5.0)
Appendix 5 IP67 and EN 12830
IP67
IP67 means that the instrument aer submersion in water at a depth of 1m at a temperature within 5°C of that of the instrument for a duraon of 30 minutes, shall suer only limited ingress. If any ingress occurs it shall not cause the instrument to operate incorrectly or to become unsafe.
Comark tests all products rated to IP67 for no ingress.
BS EN12830
The EVt2 and N2011 Data Loggers have been improved in response to European Standard EN12830:2002. The standard dictates that all temperature monitoring instruments used in the transport, warehousing and storage of Quick Frozen Foodstus comply and furthermore, documents must be kept to prove that the instruments comply.
If you work in this industry and have to comply with this standard than EVt2 and N2011 can form part of your daily management procedures.
Appendix 6 - Evt2 Data Logger LCD Enunciators
The LCD on the EVt2 Data logger includes the following Enunciators.
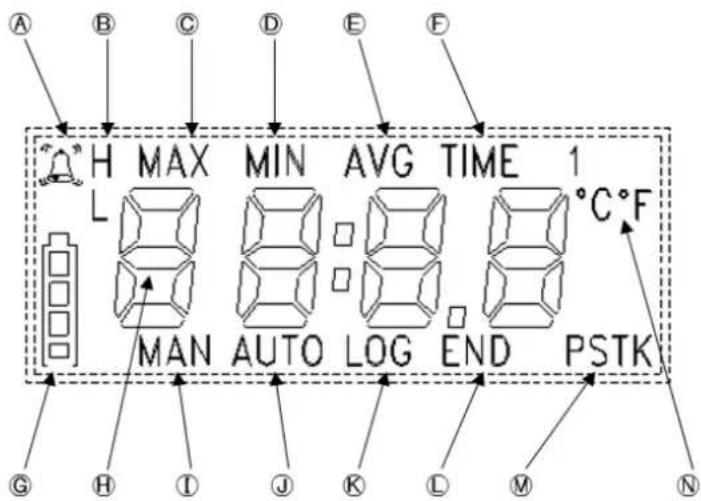
text_image
A B C D E F H MAX MIN AVG TIME 1 L MAN AUTO LOG END PSTK G H I J K L M NFig 1 Datalogger LCD
A Alarm Indicaon.
⑧ H for High Alarm. L for Low Alarm
© Indicates MAXimum recorded temperature
(D) Indicates MINimum recorded temperature
E Indicates AVErage recorded temperature
F Indicates current TIME
G Indicates baery status
⑧ 4-Digit display for Temperature/Time
① Indicates ready for MANual start
J Indicates ready for AUTO Start
K Indicates LOGging in progress
L Indicates LOGging nished
M Indicates the Sensor Type in use
N Indicates current scale
Appendix 7 - N2000 Data Logger LCD Enunciators
The LCD on the N2000 Data loggers includes the following Enunciators.
Note: Note all enunciators will be available on all versions of the Loggers.

text_image
A B C °C°F %RH H L dp G LOGAUTOMANCAL FULL F EFig 1. N2000 Data Logger LCD
The following items appear on the display:
Ⓐ Low Baery Symbol
⑧ 4 Digit readings area/Time display
© Scales °C/°F/%RH/dp
(D) Channel number display
◎ Indicates AVErage recorded temperature
⑤ LOG Indicates logging acve
AUTO Indicates dated logging start MAN Indicates manual logging start CAL Indicates calibraon due
© Alarm Status display
Appendix 8 - Specifications
Sensor Type
Temperature
EVt2/N2011/N2012/N2013 Thermistor
N2014 Thermocouple
Humidity
N2013 Capacive Polymer
Other parameters
N2015 4-20mA Current
Measurement Range
EVt2 -30°C to 70°C (-22°F to 158°F)
N2011 -40^/-40^ to +70^/+158^
N2012 Internal sensor -40^/-40^ to +70^/+158^
External Sensor -40°C/-40°F to +150°C/+302°F
N2013 Temperature -20^/-4^ to +60^/+140^
Humidity 0 to 97% RH non condensing
N2014 External T Sensor -200°C/-328°F to +400°C/+752°F
External K Sensor -200°C/-328°F to +1372°C/+2500°F
Ambient Sensor -40^/-40^ to +70^/+158^
N2015 3.9mA to 20.1mA
Displayable Scales
Temperature °C or °F
Humidity %rh or dew point
Display Resoluon
System Accuracy (N2011, N2012, N2013)
Temperature -25°C/-13°F to +50°C/+122°F ±0.5°C/1°F
-40°C/-40°F to +80°C/+176°F ±1°C/2°F
-40°C/-40°F to +150°C/+302°F ±2°C/4°F (typical)
Humidity -20°C/-4°F to +60°C/+140°F ±3% RH
Resoluon (N2014)
Ambient Sensor 0.1°
Thermocouple 0.2^/0.5^ (-200°C/-328°F to +300°C/+572°F) 0.5^/1^ (Above 300^/572^ )
Accuracy (N2014)
Ambient +20°C/68°F ± (0.5°C/0.9°F + 0.3% Reading)
Ambient -20^/-4^ to 40^/104^ ± (0.5^/0.9^ + 0.5% Reading)
Ambient -40^/^ to 70^/158^ ±(1^/1.8^+1% Reading)
Ambient (CJC)
-20^ / -4^ to 40^ / 104^ ± 0.3^ / 0.6^
-40^ / -40^ to 70^ / 158^ ± 0.5^ / 0.9^
Accuracy (N2015)
Ambient 20°C/68°F +/-0.3% of Full Scale
Ambient -40°C/°F to 70°C/158°F +/-0.5% of Full Scale
Display Resoluon (N2015) 0 or 1dp
Logging Memory Capacity
1 channel 3000 Samples (Evt2)
16,181 samples (N2011)
2 channels 8,090 samples
3 channels 5,393 samples
4 channels 4,045 samples
5 channels 3,236 samples
Communications via infra-red interface
Logging Frequency Programmable between 1 second and 99 hours
Internal Sensor Response Time T _90 =15 to 30 minutes in ambient air
Ambient Storage -40°C/-40°F to +70°C/+158°F
Baery 1 x AA size 3.6V replaceable lithium baery (Customer replaceable) 12 x AA size 3.6V replaceable lithium baery (non-replaceable)
Baery Life Up to 2 years (EVt2) and up to 5 Years (N2000) (1 reading every 15 minutes at 20°C ambient with alarms o)
Case Material N2000 – ABS EVt2 – Over-moulded Polycarbonate
Environmental Protecon IP67, EN60529, IEC529
Other Cercaons
EVt2 and N2011 Cered to meet Transport Standard EN 12830:1999
LED Indicaon Red = alarm, green = logger acve
Dimensions L 88mm (including xing lug) W 80mm D 35mm
Weights
| EVt2 | 77g/2.73 oz |
| N2011 | 103gms/ 3.6oz |
| N2012 | 119gms/ 4.2oz |
| N2013 | 117gms/ 4.1oz |
| N2014 | 119gms/ 4.2oz |
| N2015 | 119gms/ 4.2oz |
Appendix 8 -Wiring N2015
The Diligence EV N2015 allows monitoring and logging of the loop current in a 4-20mA system. The unit does not provide loop power and is intended for wiring into an exisng transmier circuit. The N2015 socket accepts a Lumberg SV60 locking plug. A pre-wired plug with wire tails is supplied to facilitate wiring into the current loop. The red wire is positive, white is negave.
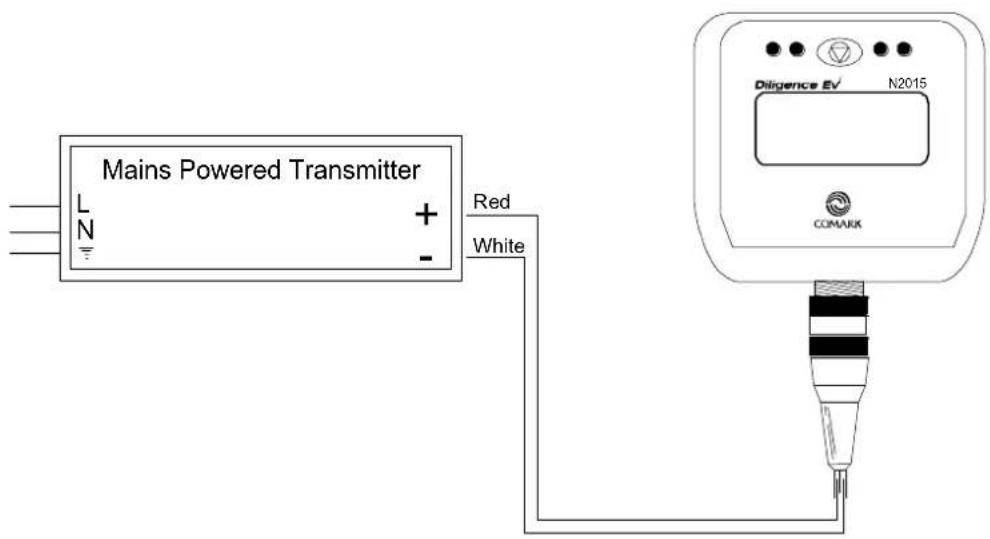
text_image
Mains Powered Transmitter L N + - Red White Diligence EV N2015 COMARKFig 1. Example Wiring
The pin-out is given below if the user wishes to make his own connector arrangement.

text_image
+ve -veFig 2. Connector Pin-out
Comark Instruments
52 Hurricane Way,
Norwich, Norfolk NR6 6JB England
Tel: 0207 (+44 207) 942 0712
Email: sales@comarkinstruments.com
Comark Instruments
PO Box 500,
Beaverton, OR 97077, USA
Tel: (503) 643 5204
Email: sales@comarkUSA.com
© Comark Instruments