SFAH-200U-G14FS-PNLK-PNVBA-M8 - Measurement Festo - Free user manual and instructions
Find the device manual for free SFAH-200U-G14FS-PNLK-PNVBA-M8 Festo in PDF.


| Product Type | Compressed Air Flow Sensor |
| Model | SFAH-200U-G14FS-PNLK-PNVBA-M8 |
| Measuring Range | 0.2 - 200 l/min (standard conditions) |
| Measuring Medium | Compressed air, inert gases |
| Operating Pressure | 0.5 - 10 bar |
| Supply Voltage | 24 V DC (10 - 30 V DC) |
| Output Signal | PNP/NPN, 4-20 mA, switching output |
| Electrical Connection | M8 connector |
| Process Connection | G1/4" FS (flat seal) |
| Accuracy | ±3% of reading ±0.1% FS |
| Repeatability | < 1% |
| Response Time | < 50 ms |
| Protection Class | IP65 (with connector) |
| Ambient Temperature | 0 - 50 °C |
| Medium Temperature | -10 - 70 °C |
| Housing Material | Polyamide, stainless steel (wetted parts) |
| Dimensions (L x W x H) | Approx. 100 x 40 x 40 mm |
| Weight | Approx. 150 g |
| Maintenance | No regular maintenance required; keep filters clean if present |
| Safety | Protection against reverse polarity, overvoltage, short circuit |
Frequently Asked Questions - SFAH-200U-G14FS-PNLK-PNVBA-M8 Festo
User questions about SFAH-200U-G14FS-PNLK-PNVBA-M8 Festo
0 question about this device. Answer the ones you know or ask your own.
Ask a new question about this device
Download the instructions for your Measurement in PDF format for free! Find your manual SFAH-200U-G14FS-PNLK-PNVBA-M8 - Festo and take your electronic device back in hand. On this page are published all the documents necessary for the use of your device. SFAH-200U-G14FS-PNLK-PNVBA-M8 by Festo.
USER MANUAL SFAH-200U-G14FS-PNLK-PNVBA-M8 Festo
natural_image
Line drawing of a digital camera module with lens and buttons (no text or symbols)FESTO
Operating instruction
Translation of the original instructions
IO-Link is a registered trademark of its respective trademark holder in certain countries.
Table of contents
1 Applicable documents.... 5
2 Safety....5
2.1 Safety instructions....5
2.2 Intended use.... 5
2.3 Training of qualified personnel....5
2.4 UL/CSA certification.... 5
3 Additional information....6
4 Product overview.... 6
4.1 Structure....6
4.1.1 Product design....6
4.1.2 Display components....7
4.2 Function.... 10
4.2.1 Functional principle.... 10
4.2.2 Operating statuses.... 10
4.2.3 Switching outputs.... 11
4.2.4 Standard switching condition for volume values - 'REF'/'Cond'. 13
4.2.5 Filter.... 14
4.2.6 Analogue output.... 14
4.2.7 Minimum value and maximum value....15
4.2.8 Replicate parameter function....15
4.2.9 Offset adjustment.... 15
5 Assembly....16
5.1 Mounting the sensor on the H-rail.... 16
5.2 Mounting the sensor with wall mounting.... 17
5.3 Mounting sensor on plate....17
5.4 Mounting sensor on plate at the side.... 18
5.5 Mounting sensor with front panel mounting kit.... 18
6 Installation.... 19
6.1 Pneumatic installation.... 19
6.1.1 Infeed situation.... 19
6.2 Electrical installation.... 20
7 Commissioning....21
7.1 Switching on the sensor in RUN mode 21
7.2 Displaying parameters in SHOW mode.... 21
7.3 Configuring the sensor in EDIT mode.... 23
7.3.1 Entering security code.... 23
7.3.2 Configuring the switching output.... 24
7.3.3 Changing device settings.... 25
7.3.4 Setting the volume pulse output.... 25
7.3.5 Setting the analogue output.... 25
7.3.6 Replicating parameters.... 26
7.3.7 Performing offset adjustment.... 26
7.4 Teaching switching points in TEACH mode.... 27
8 IO-Link interface description.... 27
8.1 General information, IO-Link.... 27
8.2 Identification parameters.... 29
8.3 IO-Link default parameters.... 29
8.4 IO-Link system commands.... 30
8.5 Smart sensor profile parameters.... 31
8.6 Device-specific parameters....33
8.7 IO-Link teach-in.... 36
8.8 Block parameterisation.... 37
8.9 Process data IN.... 38
8.10 Conversion factors....39
8.10.1 Conversion factors for process data variable, process data variable min, process data variable max, and setpoint values SP1, SP2.... 39
8.10.2 Conversion factors for hysteresis, switching point d.SP and max. signal delta (S.obS).... 40
8.10.3 Conversion factors for volume units and mass units....41
8.10.4 Scaling factors for gases.... 42
8.11 IO-Link diagnostics.... 42
9 Operation.... 43
9.1 Switching on the Sensor.... 43
9.2 Restoring factory settings (Restore).... 43
10 Malfunctions....43
10.1 Fault clearance....43
10.2 Error messages.... 44
11 Removal....45
12 Technical data....45
12.1 Technical data, general.... 45
12.2 Technical data for UL/CSA certification....51
12.3 Examples for calculating the maximum error of the display.... 51
1 Applicable documents

All available documents for the product → www.festo.com/sp.
| Document Content | |
| IO-Link IODD Device description file |
Tab. 1: Applicable documents
2 Safety
2.1 Safety instructions
- Only use the product in its original condition without unauthorised modifications.
-Only use the product if it is in perfect technical condition.
-Observe labelling on the product. - Only use media in accordance with the specifications Technical data.
- The product may generate high frequency interference, which may require interference suppression measures in residential areas.
2.2 Intended use
The flow sensor monitors the flow rate of gaseous media in pipe systems or terminals in industrial applications.
2.3 Training of qualified personnel
Work on the product may only be carried out by qualified personnel who can evaluate the work and detect dangers. The qualified personnel have skills and experience in dealing with electropneumatic (open-loop) control technology.
2.4 UL/CSA certification
In combination with the UL inspection mark on the product, the information in this section must also be observed in order to comply with the certification conditions of Underwriters Laboratories Inc. (UL) for USA and Canada.
UL/CSA certification information
| Product category code QUYX, QUYX7 | |
| File number E322346 | |
| Considered standards UL 61010-1 | CAN/CSA C22.2 No. 61010-1 |
| UL mark |  |
Tab. 2: UL/CSA certification information
The Front panel mounting kit SAMH-FH-F can be used only for mounting SFAH behind a plate. Cabinet mounting was not evaluated by UL.

WARNING
The unit shall be supplied by a power source which fulfils the requirements on a limited-energy circuit in accordance to IEC/EN/UL/CSA 61010-1 or on a Limited Power Source (LPS) in accordance to IEC/EN/UL/CSA 60950-1 or IEC/EN/UL/CSA 62368-1 or a Class 2 circuit in accordance to NEC or CEC.
3 Additional information
- Contact the regional Festo contact if you have technical problems → www.festo.com. - Accessories and spare parts → www.festo.com/catalogue.
4 Product overview
4.1 Structure
4.1.1 Product design
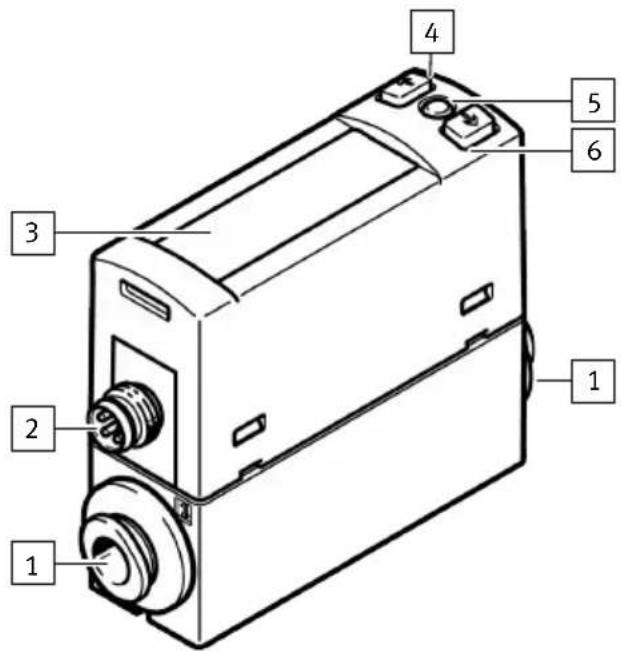
1 Pneumatic port; identification on the product
2 Plug for electrical connection
3 Display
4 [A] key
5 [Edit] key
6 [B] key
Fig. 1: Product design
4.1.2 Display components
flowchart
graph TD
    A["Lock"] --> B["Spec"]
    B --> C["Option"]
    C --> D["Anlg OutB"]
    D --> E["Puls OutA"]
    style A fill:#f9f,stroke:#333
    style B fill:#f9f,stroke:#333
    style C fill:#f9f,stroke:#333
    style D fill:#f9f,stroke:#333
    style E fill:#ccf,stroke:#333
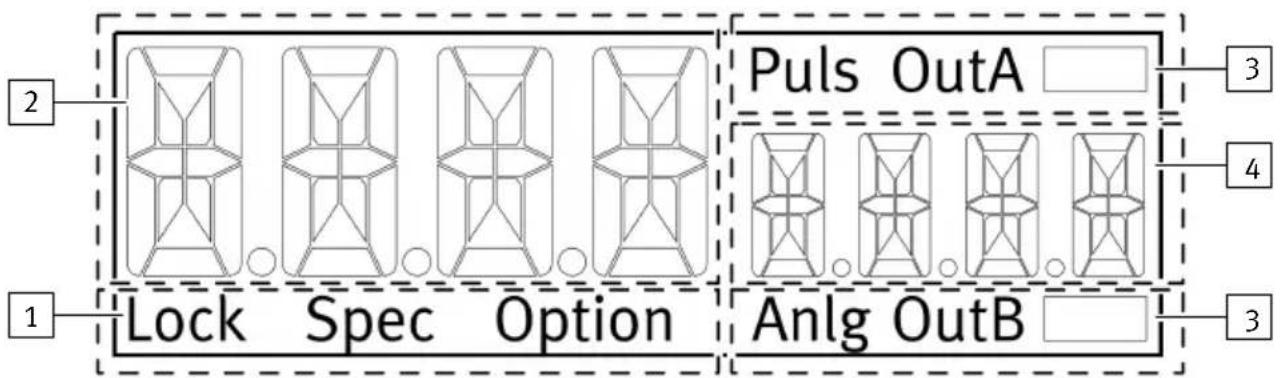
Fig. 2: LCD display
1 Status information
3 Output display
2 Main display, e. g. measured value
4 Sub-display, e.g. unit
3 Output display
Symbols on the display
| Example for LCD display Description | |
| Output display | |
| ‘OutA’ Switching output OutA selected/activated, flashes with active IO-Link | |
| ‘OutA’ Switching output OutA set | |
| ‘OutB’ Switching output OutB selected/activated | |
| ‘OutB’ Switching output OutB set | |
| ‘Pulse’ Analogue output for volume pulse and mass pulse selected | |
| ‘Anlg’ Analogue output for flow rate selected/activated | |
| Status information | |
| ‘Lock’ Security code activated | |
| ‘Spec’ Special menu selected | |
| ‘Option’ Parameters that influence the measured value display have been changed from the factory setting: reference condition (standard) or gas | |
Tab. 3: Output display and status information
| Example for LCD display Description | ||
| Main display Sub-display | ||
| Measured value indicator and unit in RUN mode | ||
| ‘-0.53’ ‘L.Min’ Measured value indicator and unit | ||
| Menu items for the OutA and OutB switching outputs | ||
| ‘Edit’ ‘bin’ EDIT menu for the switching outputs | ||
| ‘_I’’ ‘Fctn’ Threshold value comparator | ||
| ‘_I’_’ ‘Fctn’ Window comparator | ||
| ‘d_[]’’ ‘Fctn’ Auto difference monitor | ||
| ‘18.0’ ‘SP’ Switching point value | ||
| ‘1.80’ ‘SP.Lo’ Value of lower switching point | ||
| ‘6.45’ ‘SP.Hi’ Value of upper switching point | ||
| ‘0.50’ ‘HY’ Hysteresis value | ||
| ‘18’ ‘t.obS’/‘MSEC’ 1) | Time interval for determination of the signal change, which is used to establish the reference value. | |
| ‘0.25’ ‘d.SP’ Threshold value for determination of the monitoring range | ||
| ‘N/O’ ‘LOGC’ | Switching characteristics of the switching outputs: ‘NO’ = N/O contact, ‘NC’ = N/C contact | |
| ‘bLUE’ ‘COLR’ | Display colour | |
| Extreme values, SHOW mode only | ||
| ‘1.64’ ‘MIN’ Minimum measured value since switching on the supply voltage or since the last reset | ||
| ‘8.50’ ‘MAX’ Maximum measured value since switching on the supply voltage or since the last reset | ||
| ‘20.8’ ‘AVER’ Average of the flow rate measurement, filter time constants | ||
| Additional settings | ||
| ‘100’ ‘PULS’ Duration of the volume pulse or mass pulse at the output | ||
| Analogue output | ||
| ‘Edit’ ‘ANLG’ EDIT menu for the analogue output | ||
| ‘0...10’ ‘Out’/‘V’1) | Output function of the analogue output | |
| ‘100’ ‘In.Hi’/‘%’ | 1) | Scaling of the analogue output to the end value of the flow measuring range in percent of FS |
| ‘-100’ ‘In.Lo’/‘%’ | 1) | Scaling of the analogue output to the start value of the flow measuring range in percent of FS |
| Menu for Spec device settings | ||
| ‘Edit’ ‘Menu’ EDIT | menu for additional settings | |
| ‘16’ ‘Filt’/‘MSEC’ | 1) | Value of the filter time constant for the measurement signal |
| ‘L.Min’ ‘FLOW’/‘Unit’ | Display unit for flow rate | measurement |
| ‘0°C’ ‘REF’/‘Cond’ | 1) | Reference standard for gas volume |
| ‘Air’ ‘GAS’ Selection of the operating medium | ||
| ‘1->2’ ‘FLOW’/‘Path’ | 1) | Selection of the flow direction from port 1 to port 2 or vice versa, only with bidirectional calibrated product variant |
| ‘ON’ ‘Z.Adj’ Offset | adjustment for display, switching output and analogue output | |
| ‘Unit’ | ‘Sub.d’ | Settings of the sub-display in RUN mode: selected unit or switching point of OutA or bar graph or gas or flow direction |
| ‘40’ ‘Eco’/‘SEC’ | 1) | Economy mode: Time period after which the display backlight is switched off |
| ‘PNP’ | ‘bin’/‘Out1) | Switchover of the switching outputs between PNP and NPN |
| ‘Flow’ | ‘bin’/‘Pin41) | Shift of binary switching output or pulse output. Pin 4 with M8 variant, pin 2 with L1 variant |
| ‘bin’ ‘FLOW’/‘Pin2’ | 1) | Switching binary switching output or analogue output at pin 2 with M8 variant, pin 3 with L1 variant |
| ‘OFF’ | ‘Code’ Activation and specification of the security code | |
| ‘OFF’ | ‘MASt’ | Activation of the IO-Link master function for replication of parameters |
1) flashing alternately
Tab. 4: Example for LCD display
4.2 Function
4.2.1 Functional principle
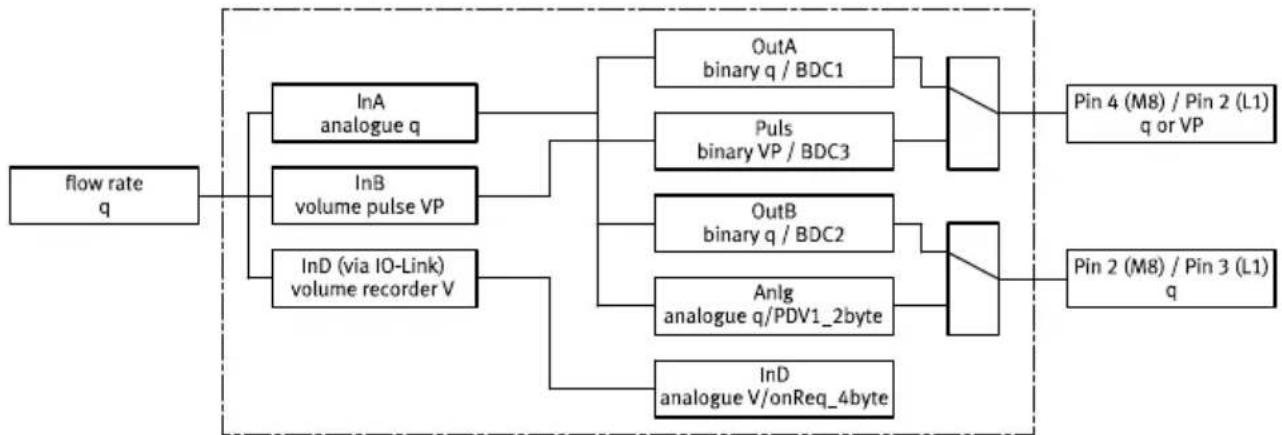
The sensor measures the flow rate (standard volume flow rate, mass flow rate) by a thermal process. The flow rates are measured by a micromechanical sensor element with a downstream electronic evaluation unit. The sensor is connected to higher-level systems via switching outputs, a volume switching pulse, an analogue output or an IO-Link interface. Depending on their configuration, the switching outputs monitor a threshold value, an analogue input or a signal change. The outputs can be set as PNP or NPN and normally open (NO) or normally closed (NC). Process values can be read out and parameters can be changed and transmitted to additional devices through the IO-Link interface. A volume signal/mass signal can be calculated and output via a pulse output along with a cumulative measured value via IO-Link by integration of the flow rate.
flowchart
graph TD
    A["flow rate q"] --> B["InA analogue q"]
    A --> C["InB volume pulse VP"]
    A --> D["InD (via IO-Link) volume recorder V"]
    B --> E["OutA binary q / BDC1"]
    B --> F["Puls binary VP / BDC3"]
    C --> G["OutB binary q / BDC2"]
    C --> H["Anlg analogue q/PDV1_2byte"]
    D --> I["InD analogue V/onReq_4byte"]
    E --> J["Pin 4 (M8) / Pin 2 (L1) q or VP"]
    F --> K["Pin 2 (M8) / Pin 3 (L1) q"]
    G --> L["Pin 2 (M8) / Pin 3 (L1) q"]
Fig. 3: SFAH signal structure
4.2.2 Operating statuses
| Operating status Function | |
| RUN mode | - Basic status after the operating voltage is applied- Display of the current measured value.- Display of the selected inputs and outputs.- Switching between the flow rate and volume/mass measured variables. |
| SHOW mode | - Display of the current settings of the switching outputs and analogue output.- Display and reset of minimum and maximum values.- Display of the average flow rate measurement. |
| EDIT mode | - Setting parameters. |
| TEACH mode | - Acceptance of the current measured value to specify switching points. |
Tab. 5: SFAH operating statuses
4.2.3 Switching outputs
4.2.3.1 Switching functions
Threshold value comparator
| Function Normally open contact (N/O) Normally closed contact (N/C) | ||
| Switching function:- 1 switching point (SP) | 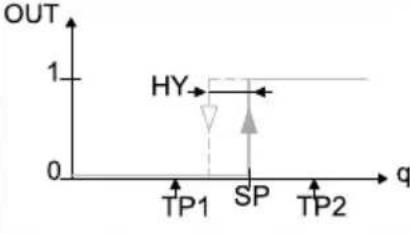 | 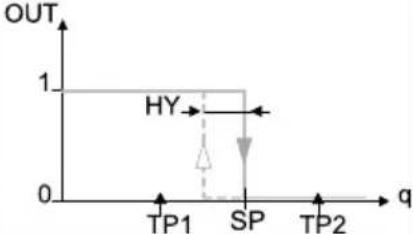 |
| TEACH mode:- 2 teach points (TP1, TP2)- SP = 1/2 (TP1 + TP2) | ||
Tab. 6: Threshold value comparator
Window comparator
| Function Normally open contact (N/O) Normally closed contact (N/C) | ||
| Switching function:– 2 switching points (SP.Lo, SP.Hi) | 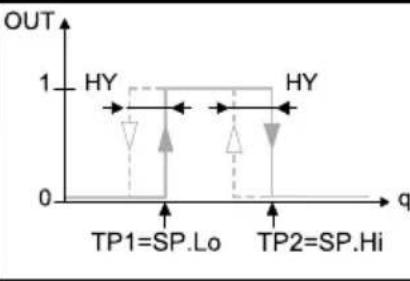 | 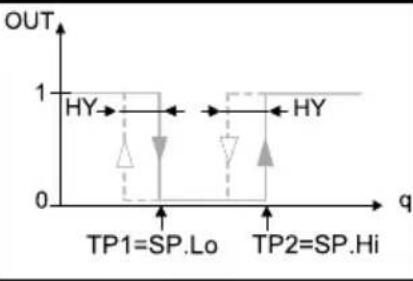 |
| TEACH mode:1)– 2 teach points (TP1, TP2)– TP1 = SP.Lo, TP2 = SP.Hi | ||
1) SP.Lo = lower value, SP.Hi = higher value, independent of the teach sequence
Tab. 7: Window comparator
Auto difference monitoring d\_[]
Auto difference monitoring can be used to monitor the consistency of a signal value. If the applied signal is consistent within the range between 'SP.Lo' and 'SP.Hi', the reference value qRef is set automatically. Consistent means that over the 't.obS' period the maximum signal change 'S.obS' is less than 0.2% FS. This results in a switching operation at the output and signals the start of the signal monitoring. The signal is stable if it remains in the 'd.SP' monitoring range around qRef. If it leaves the monitoring range the output switches back.
![Festo SFAH-200U-G14FS-PNLK-PNVBA-M8 - Auto difference monitoring d\_[] - 1](/content/2026/05/1044976/images/6359669b4bb94b2a4b957554819a80990abd9e27ef1d56ef0b63388bad1f6f55.jpg)
line
| Time | SP.Hi | SP.Lo | |------|-------|-------| | t | q_ref | 0 | | t.obS | q_ref | 0 | | d.SP | q_ref | 0 | | t | 1 | 0 | | t | 1 | 1 |1 Reference value qRef is determined
2 Measured value deviates 'd.SP' from the reference value
3 Monitoring range
Fig. 4: Auto difference monitor
The 'SP.Lo', 'SP.Hi', 't.obS' and 'd.SP' parameters can be freely configured. The higher 't.obS' is set the greater the required signal stability in order to define the reference value qRef. The limit value for a maximum signal change 'S.obS' can only be adjusted via IO-Link.
| Function Normally open contact (N/O) Normally closed contact (N/C) | ||
| Switching function:- 2 switching points (SP.Lo, SP.Hi) for setting the valid working range- 1 switching point (d.SP) for determining the monitoring range | ![Festo SFAH-200U-G14FS-PNLK-PNVBA-M8 - Auto difference monitoring d\_[] - 2](/content/2026/05/1044976/images/51aad8762e0c8516fa569c728cd6dfb4dc9322b35b6e1e553216619e8200e63a.jpg) | ![Festo SFAH-200U-G14FS-PNLK-PNVBA-M8 - Auto difference monitoring d\_[] - 3](/content/2026/05/1044976/images/ab45d00ff8539f0662b9fa886644f5df1a2fc8c89c49ff8c5be0a7591847589b.jpg) |
| TEACH mode:1)- 2 teach points (TP1, TP2)- TP1 = SP.Lo, TP2 = SP.Hi | ||
1) SP.Lo = lower signal value, SP.Hi = higher signal value, independent of the teach sequence
Tab. 8: Window comparator: auto difference monitoring
4.2.3.2 Colour change of the display
A red colour change can be set in the display for the switching outputs OutA and OutB depending on the switching status. The colour change enables the system status to be identified from a greater distance. Depending on the setting the colour change reacts both to OutA and to OutB.
| Parameter Meaning | |
| ‘bLUE’ The display is always blue; the colour change function is disabled. | |
| ‘R.On’ The display is red if the switching output is set (high = 1).The display is blue if the switching output is not set (low = 0). | |
| ‘R.OFF’ The display is red if the switching output is not set (low = 0).The display is blue if the switching output is set (high = 1). | |
Tab. 9: Colour change of the display
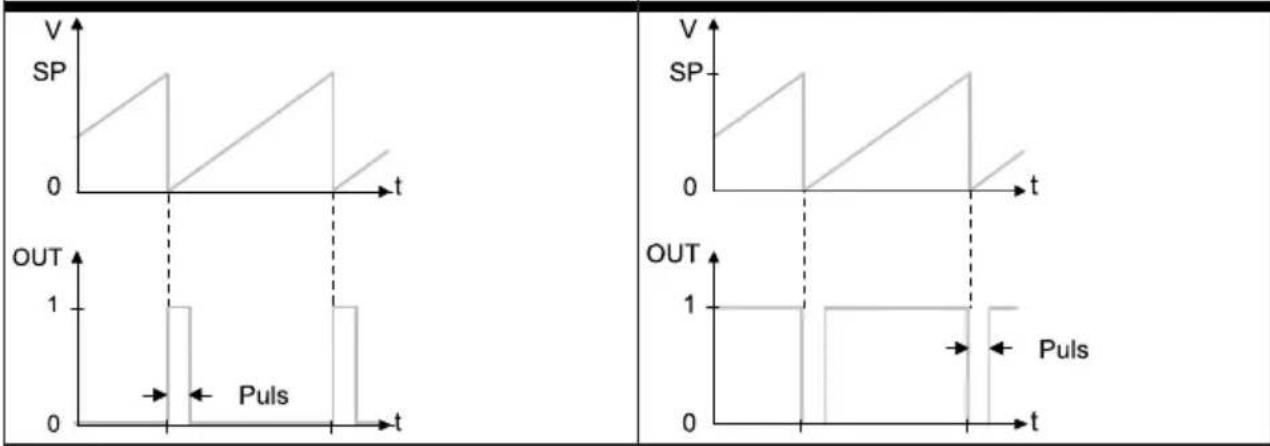
4.2.3.3 Volume pulse/mass pulse
A threshold value SP can be set for the volume and/or the mass with the cumulative volume measurement/mass measurement. If the configured threshold value is reached, the sensor sends a switching pulse at the pulse output ( Fig. 3) for an adjustable time. The volume measurement/mass measurement is restarted at every switching pulse.
Normally open contact setting (N/O) Normally closed contact setting (N/C)
line
| Time | V (SP) | OUT (OUT) | | :--- | :--- | :--- | | t0 | 0 | 0 | | t1 | 1 | 1 | | t2 | 0 | 0 | | t3 | 1 | 1 | | t4 | 0 | 0 |Tab. 10: Volume pulse/mass pulse with cumulative volume measurement/mass measurement
4.2.4 Standard switching condition for volume values - 'REF'/'Cond'
The represented flow rate units can be related to different standard conditions. It is possible to switch between the following standard conditions. The corresponding standard is defined by selection of the reference temperature in the menu guiding on the display.
| ‘REF’/‘Cond’ Off 15 °C 20 °C | ||||
| Standard DIN 1343 ISO 2533 ISO 6358 | ||||
| Air pressure (absolute) | [bar] | 1.01325 | 1.01325 | 1 |
| [kPa] | 101.325 | 101.325 | 100 | |
| Temperature | [°C] | 0 | 15 | 20 |
| Humidity | [%] | 0 | 0 | 65 |
| ‘REF’/‘Cond’ Off 15 °C 20 °C | |||
| Status information (option) Light off Light on Light on | |||
| Correction factor, measurement range end value | 1 1.055 1.087 |
Tab. 11: Standard condition for volume values
The sensor is factory calibrated to the physical standard conditions in accordance with DIN 1343. If a different standard from DIN 1343 is selected, this changes the specified measurement range (± 100% FS) by the defined correction factor. This change is shown on the display by 'Option'. Only the display on the sensor monitor is adjusted when the reference standard is switched. If necessary, the effect on the nominal measurement range of the specific sensor must also be considered when evaluating the analogue output.
4.2.5 Filter
The low-pass filter ‘Filt’ smoothes the flow rate input signal. It also changes the rise time and the fall time. Filtering affects all outputs. The filter time corresponds to the time constant T of a low-pass filter. In the SHOW mode a smoothed average ‘AVER’ of the flow rate measurement can be displayed.
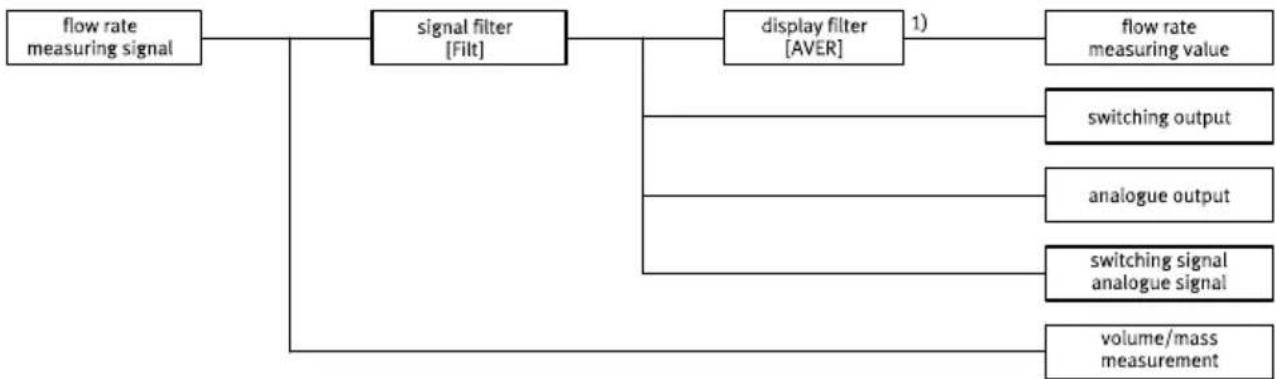
flowchart
graph TD
    A["flow rate measuring signal"] --> B["signal filter [Filt"]]
    B --> C["display filter [AVER"]]
    C --> D["flow rate measuring value"]
    C --> E["switching output"]
    C --> F["analogue output"]
    C --> G["switching signal analogue signal"]
    C --> H["volume/mass measurement"]
Fig. 5: Example: scaling of the analogue signal at the current output
1) The display filter is only active while 'AVER' is selected in SHOW mode.
4.2.6 Analogue output
Analogue signal
The analogue output can be configured either as voltage output 0 ... 10 V or 1 ... 5 V or as current output 4 ... 20 mA. The voltage output is factory-set to 0 ... 10 V.
Scaling of the analogue signal
With the bidirectional sensor variants, the analogue output signal is 0 ... 10 V, 1 ... 5 V or 4 ... 20 mA the complete sensing range (-100 ... 100% FS) and with the unidirectional sensor variants the analogue output signal is assigned to the positive sensing range (0 ... 100% FS). If only a part of the sensing range is to be used, the analogue value output can be scaled to this partial sensing range with the 'In.Lo' and 'In.Hi' parameters.
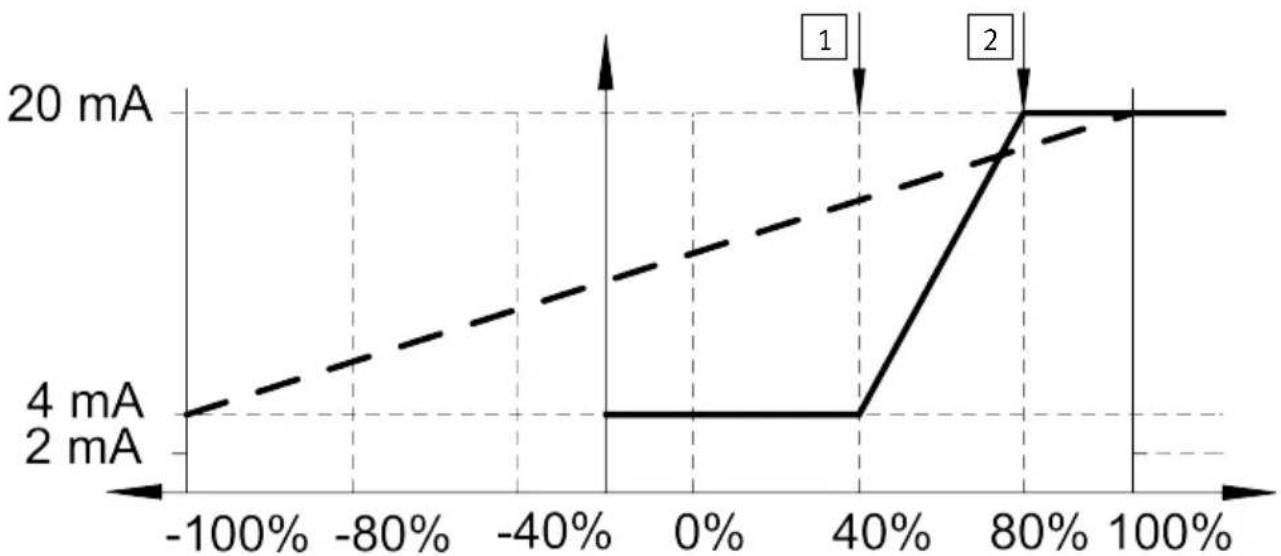
line
| Voltage | Current | | ------- | ------- | | -100% | 2 mA | | -80% | 4 mA | | -40% | 4 mA | | 0% | 4 mA | | 40% | 4 mA | | 80% | 20 mA | | 100% | 20 mA |Fig. 6: Scaling the analogue signal at the current output
1 Starting point of the scaled sensing range (In.Lo)
2 End point of the scaled sensing range (In.Hi)
4.2.7 Minimum value and maximum value
The minimum values and the maximum values for the flow rate measurement are displayed and reset in the SHOW mode.
i
Switching off the operating voltage resets the minimum and maximum values.
4.2.8 Replicate parameter function
This function enables all settings that have been carried out on one sensor (master) to be transferred to other identical sensors (device).
Parameters are transferred with the IO-Link functions. The configured sensor is set to a master mode and can then send its parameters to an identical device sensor (identical device ID).
4.2.9 Offset adjustment
An offset adjustment can be made for the zero point. The offset adjustment influences the display and all outputs. The offset adjustment is only available with the zero adjust setting = 'ON'. As a result, the zero range hiding is no longer active. The zero adjust function 'Z.Adj' to 'ON' is the default setting for bidirectional sensor types. If 'Z.Adj' is set to 'ON', the offset error visible on the display can be set to zero by a zero adjust teach process. This requires the measured value in the ± 3% FS range based on the original factory comparison for the teach process.
If the ‘Z.Adj’ parameter is reset to ‘OFF’, the stored adjustment value is no longer taken into account and the device takes the calibration values from the factory setting. The saved value is not lost and is used again if the ‘Z.Adj’ parameter is set to ‘ON’.
5 Assembly
NOTICE
An unfavourable mounting position may impair the function of the product.
- When selecting the mounting position, make sure that condensate from the compressed air lines cannot accumulate in the sensor.
i
Any mounting position is possible but can have an influence on measurement precision ( 12.1 Technical data, general).
5.1 Mounting the sensor on the H-rail
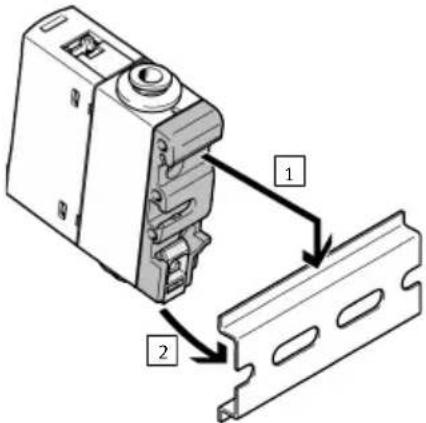
Fig. 7: H-rail mounting
- Mount the H-rail on the sensor.
-Tightening torque: maximum 0.5 Nm - Attach the H-rail mounting to the H-rail.
- Press the H-rail mounting in the direction of the arrow until the fastening lock clicks into position.
Assembly
5.2 Mounting the sensor with wall mounting
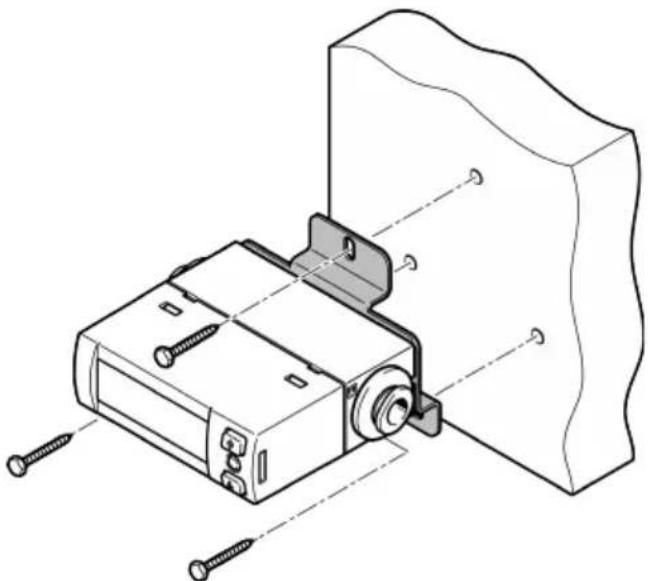
natural_image
Technical line drawing of a mechanical assembly with screws and a wall-mounted component (no text or symbols)Fig. 8: Wall mounting
- Screw the wall mounting to the sensor.
-Tightening torque: maximum 0.5 Nm
- Install the wall mounting.
5.3 Mounting sensor on plate
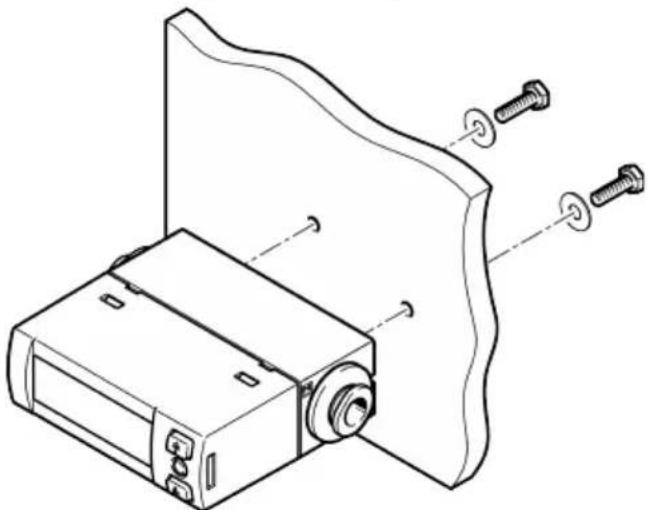
natural_image
Technical line drawing of a mechanical assembly with screws and a housing (no text or symbols)Fig. 9: Mounting on plate
- Fasten the sensor to the plate with screw of the appropriate length.
-Tightening torque: maximum 0.5 Nm
-Hole diameter: maximum 3.3 mm
5.4 Mounting sensor on plate at the side
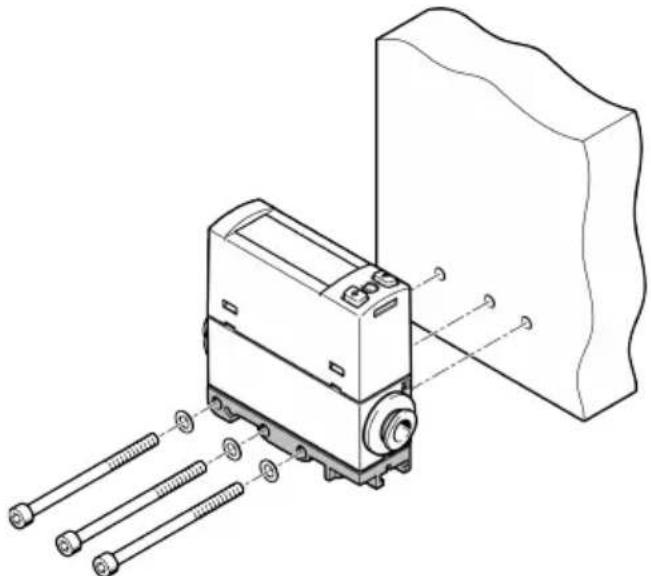
natural_image
Technical line drawing of a mechanical device with threaded components and a rectangular block (no text or symbols)Fig. 10: Plate mounting on the side
- Mount the H-rail on the sensor.
-Tightening torque: maximum 0.5 Nm - Mount the H-rail mounting on the plate with washers and M4 screws.
- Tightening torque: maximum 0.5 Nm
5.5 Mounting sensor with front panel mounting kit
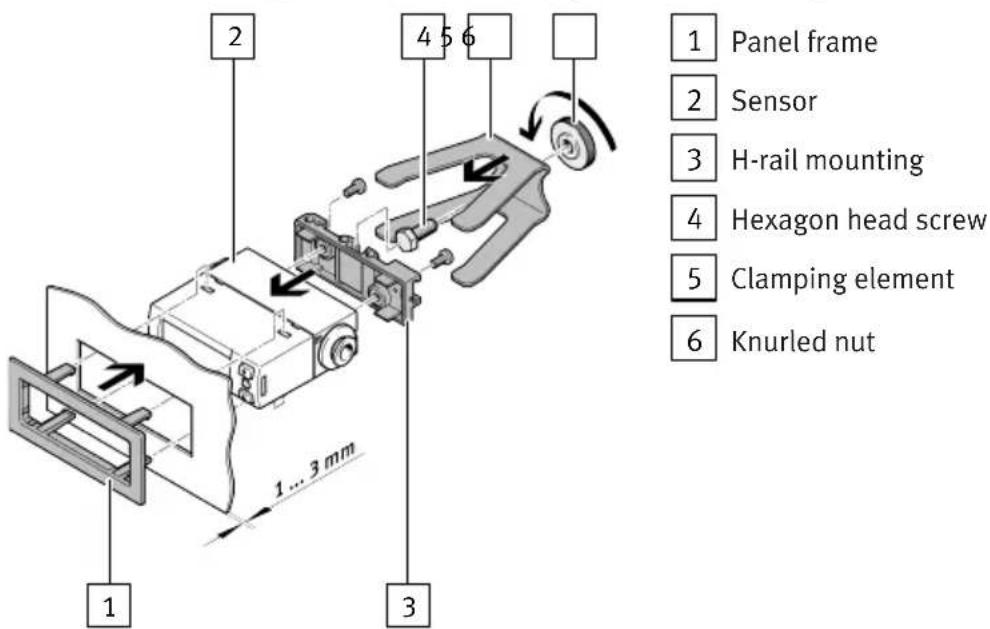
Fig. 11: Front panel mounting kit
- Mount the H-rail on the sensor.
- Tightening torque: maximum 0.5 Nm
- Mount a hexagon head screw on the H-hat rail mounting.
-
Push the panel frame through the cut-out.
-Cutout: 62 mm x 24 mm ± 0.1 mm -
Attach the sensor to the panel frame so all 4 snap-in hooks lock into place.
- Push the clamping element over the hexagon head screw.
- Lock the sensor with the enclosed knurled nut.
- Tightening torque: maximum 0.3 Nm
6 Installation
6.1 Pneumatic installation
With the unidirectional sensor SFAH-...U-... the flow rate is fed to the flow port 1 and exits at flow port 2. The direction of flow is indicated on the sensor by an arrow.
i
Unidirectional type only: if the sensor tubing is incorrectly installed, the measured values will be shown with a negative sign and will be outside the specified measurement range.
With the bidirectional sensor SFAH-...B-... the flow rate can be fed to flow port 1 or flow port 2. The flow direction can be set in EDIT mode and shown in the sub-display to display the flow direction on the monitor with the correct sign.
Installing tubing on sensor
• Install the tubing at flow port 1 and flow port 2 → Marking on product.
6.1.1 Infeed situation
The specific accuracies in accordance with the technical data will be reached if the conditions for the laminar flow inlet at the sensor are maintained.
| Min. internal diameter of the laminar flow inlet in mm | Design of the laminar flow inlet Flow measuring range in l/min | |||||||
| -0.1 -0.5 -1 -5 | -10 | -50 -1 | 100 -2 | 00 | ||||
| 2.9 Any recommended ± 2% | 1) | Not recommended2) | ||||||
| 4 Straight recommended ± 1% | 1) | |||||||
| 4 Angle directly on sensor | ||||||||
| 4 Distance of the angle in flow direction in front of the sensor: 5 ... 80 cm | ± 10%1) | |||||||
| 6 Any recommended | ||||||||
1) Deviation from the specified accuracy.
2) Operation possible. But deviations greater than 20% must be expected.
Tab. 12: Effect of the infeed conditions and port sizes on the specified accuracy
6.2 Electrical installation

WARNING
Risk of injury due to electric shock.
- Use exclusively PELV circuits in accordance with IEC 60204-1/EN 60204-1 for the electrical power supply (Protective Extra-Low Voltage, PELV).
- Observe the general requirements of IEC 60204-1/EN 60204-1 for PELV circuits.
-
Use exclusively voltage sources that guarantee reliable electrical isolation from mains power in accordance with IEC 60204-1/EN 60204-1.
-
Observe the length of the signal line 12 Technical data.
- Configure the binary outputs in accordance with their wiring in the SPEC menu → 7.3.2 Configuring the switching output.
| Plug L1 Pin Wire colour | 1) | Allocation |
| 1 2 3 4++++ | 1 Brown (BN) Operating voltage +24 V DC | |
| 2 Black (BK) Switching output | OutA, volume pulse/mass pulse or IO-Link (C/Q cable) | |
| 3 White (WH) Switching output | OutB or analogue output | |
| 4 Blue (BU) 0 V | ||
1) Colours are applicable for connecting cables NEBS-L1...
Tab. 13: Pin allocation of plug L1
Circuit diagram SFAH-...-L1
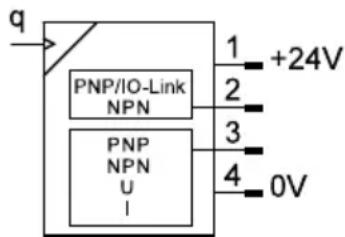
Fig. 12: Circuit diagram
| Plug M8 x 1 Pin Wire colour | 1) | Allocation | |
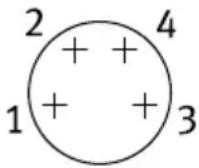 | 1 Brown (BN) Operating voltage +24 V DC | ||
| 2 White (WH) Switching output OutB or analogue output | |||
| 3 Blue (BU) 0 V | |||
| 4 Black (BK) Switching output | OutA, volume pulse/mass pulse or IO-Link (C/Q cable) | ||
1) Colours are applicable for connecting cables NEBU-M8...
Tab. 14: Pin allocation of plug M8 x 1
Commissioning
Circuit diagram SFAH-...-M8
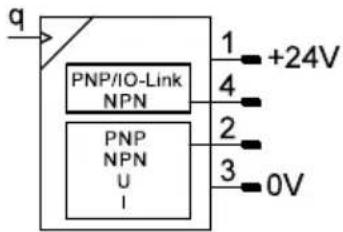
Fig. 13: Circuit diagram
7 Commissioning
7.1 Switching on the sensor in RUN mode
- Switch on the operating voltage.
The current measured value is displayed.
The sensor is in the basic status in RUN mode. The basic status can be reached as follows from other modes:
-Press and hold the [Edit] key for 3 seconds.
- After expiration of a monitoring period (timeout).
Switchover of measured value indicator
The measured value display can be switched between flow rate measurement and volume measurement/mass measurement in RUN mode.
-Switching to flow measurement: press the [A] key.
- Switching to volume measurement/mass measurement: press the [B] key.
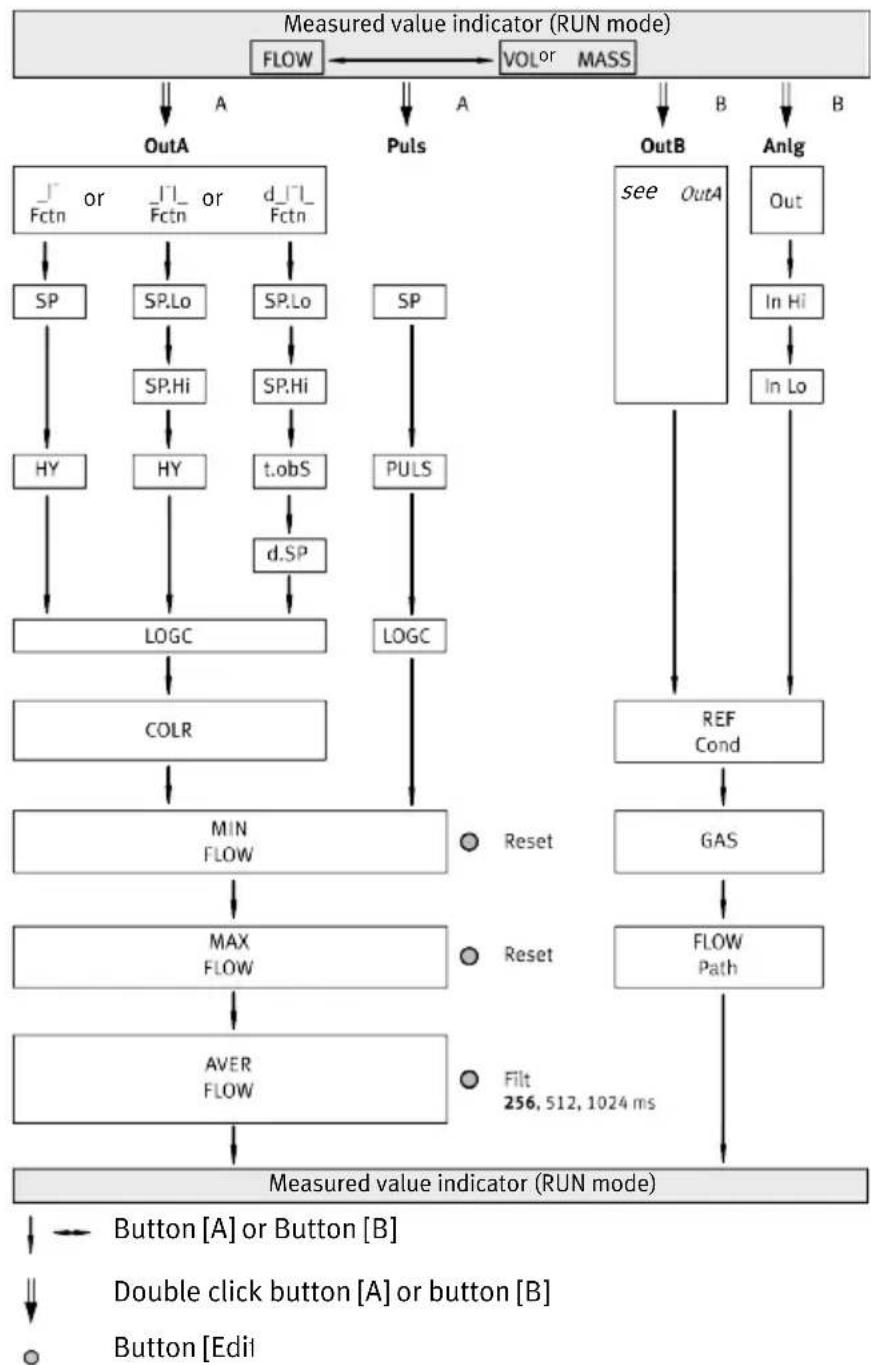
7.2 Displaying parameters in SHOW mode
Requirement: the sensor is ready for operation and is in RUN mode.
Switching output OutA or volume pulse/mass pulse at the output
- Press the [A] key twice in quick succession.
The first set parameter is displayed. 'Fctn' at OutA or 'SP' at pulse flashes.
- Press the [A] key to display each of the following parameters → Fig. 14.
Switching output OutB or analogue output Anlg
- Press the [B] key twice in quick succession.
The first set parameter is displayed. 'Fctn' at OutB or 'Out' at Anlg flashes.
- Press the [B] key to display the following parameters → Fig. 14.
Commissioning
flowchart
graph TD
    A["Measured value indicator (RUN mode)"] --> B["FLOW"]
    B --> C["VOL or MASS"]
    C --> D["A"]
    C --> E["Puls"]
    C --> F["OutA"]
    C --> G["OutB"]
    C --> H["Anlg"]
    D --> I["SP"]
    I --> J["SP,Lo"]
    J --> K["SP,Hi"]
    K --> L["HY"]
    L --> M["LOGC"]
    M --> N["COLR"]
    N --> O["MIN FLOW"]
    O --> P["MAX FLOW"]
    P --> Q["AVER FLOW"]
    Q --> R["Measured value indicator (RUN mode)"]
    R --> S["Button [A"] or_Button["B"]]
    R --> T["Double click button [A"] or_button["B"]]
    R --> U["Button [Edi"]]
    C --> V["SP"]
    V --> W["PULS"]
    W --> X["LOGC"]
    X --> Y["REF Cond"]
    Y --> Z["GAS"]
    Z --> AA["FLOW Path"]
    AA --> AB["Filt 256, 512, 1024 ms"]
Fig. 14: Menu structure in SHOW mode
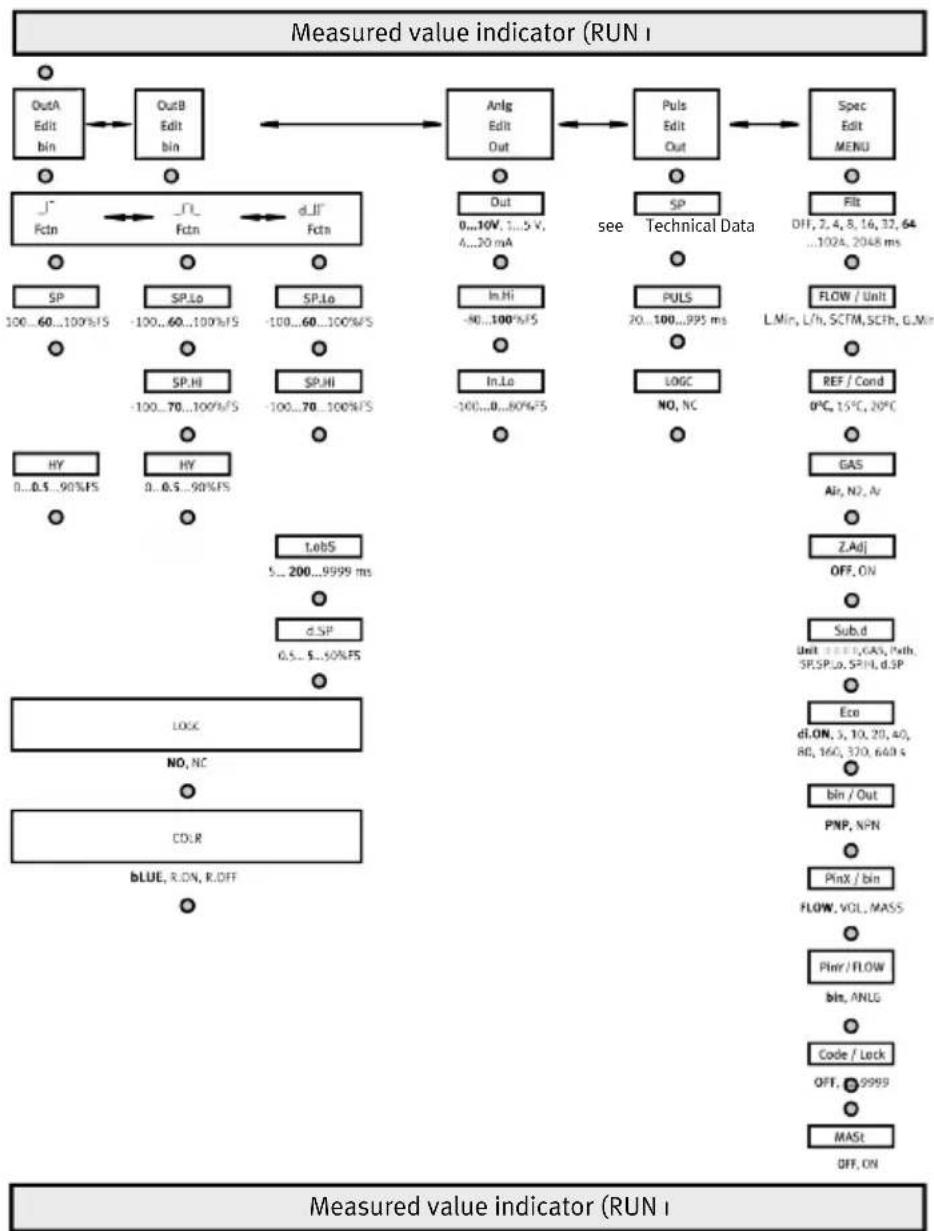
7.3 Configuring the sensor in EDIT mode
flowchart
graph TD
    A["OutA Edit bin"] --> B["OutB Edit bin"]
    B --> C["Anlg Edit Out"]
    C --> D["Puls Edit Out"]
    D --> E["Spec Edit MENU"]
    F["SP 100...60...100%FS"] --> G["SP,Lo -100...60...100%FS"]
    G --> H["SP,Hi -100...70...100%FS"]
    H --> I["HY 0...0.5...90%FS"]
    I --> J["LobS 5...200...9999 ms"]
    J --> K["d.SP 0.5...5...90%FS"]
    K --> L["LOGC NO, NC"]
    L --> M["CDLR bBLUE, R.DN, R.DFF"]
    M --> N["Code / Lock OFF, @9999"]
    N --> O["MAST OFF, ON"]
    C --> P["Out 0...10V, 1...5 V, 4...20 mA"]
    P --> Q["In.Hi -80...100%FS"]
    Q --> R["In.Lo -100...80%FS"]
    R --> S["Puls Technical Data"]
    S --> T["PULS 20...100...995 ms"]
    T --> U["LOGC NO, NC"]
    U --> V["FLOW / Unit L.Min, L/h, SCTM, SCTH, G.Min"]
    V --> W["REF / Cond 0°C, 15°C, 20°C"]
    W --> X["GAS Air, N2, Av"]
    X --> Y["Z.Adj OFF, ON"]
    Y --> Z["Sub.d Unit + ...+1,GAS,Path, SP,SP,Lo, SP,H, d.SP"]
    Z --> AA["Eco dl.ON, 3, 10, 20, 40, 80, 160, 320, 648 s"]
    AA --> AB["bin / Out PNP, NPN"]
    AB --> AC["PinX / bin FLOW, VOL, MASS"]
    AC --> AD["Pinr / FLOW bin, ANLG"]
    AD --> AE["Code / Lock OFF, @9999"]
    AE --> AF["MAST OFF, ON"]
Button [A] or Button [B]
- Button [Edit]
fett Default
Fig. 15: EDIT mode menu structure
i
Changes to the switching behaviour are effective immediately.
7.3.1 Entering security code
i
If 'Lock' 'IOL' is shown on the display, the sensor is locked by IO-Link Device Access Lock and can only be configured via IO-Link.
Requirement: the sensor is ready for operation and is in RUN mode.
- Press the [Edit] key.
The EDIT mode is active. 'OutA' flashes.
If the security code is activated, the parameter entry option is blocked: 'Lock' flashes.
-
If the security code is activated, enter the security code with the [A] or the [B] key and press the [Edit] key.
-
Press the [Edit] key.
'OutA' flashes and the parameter input is unlocked.
7.3.2 Configuring the switching output
i
The sequence for configuring the OutA and OutB switching outputs is identical. In the following, the process is described using the OutA switching output.
Requirement: the sensor is ready for operation and is in RUN mode.
- Press the [Edit] key.
‘Edit’ is displayed. ‘OutA’ flashes.
- Press the [Edit] key.
'Fctn' flashes.
-
Select the ‘_I’’, ‘_I’ I _’ or ‘d_ I ’ I _’ switching function with the [A] or [B] key.
-
Press the [Edit] key.
The set value is saved.
The next adjustable parameter is shown.
-
Set the parameter with the [A] or [B] key.
-
Repeat steps 4 and 5 until all parameters are set.
-
Press the [Edit] key.
The RUN mode is active.
7.3.3 Changing device settings
Requirement: the sensor is ready for operation and is in RUN mode.
- Press the [Edit] key.
'Edit' is displayed. 'OutA' flashes.
- Select the 'Spec' with the [A] or [B] key.
'Spec' flashes.
- Press the [Edit] key.
→ ‘Filt’ and ‘MSEC’ flash alternately.
-
Set the parameter with the [A] or [B] key.
-
Press the [Edit] key.
The set value is saved.
The next adjustable parameter is shown.
-
Repeat steps 4 and 5 until all parameters are set.
-
Press the [Edit] key.
The RUN mode is active.
7.3.4 Setting the volume pulse output
Requirement: the sensor is ready for operation and is in RUN mode.
- Press the [Edit] key.
‘Edit’ is displayed. ‘OutA’ flashes.
-
Select 'Puls' with the [A] or [B] key.
-
Press the [Edit] key.
‘SP’ and the set volume unit flash alternately.
-
Set the parameter with the [A] or [B] key.
-
Press the [Edit] key.
The set value is saved.
The next adjustable parameter is shown.
-
Repeat steps 4 and 5 until all parameters are set.
-
Press the [Edit] key.
The RUN mode is active.
7.3.5 Setting the analogue output
Requirement: the sensor is ready for operation and is in RUN mode.
- Press the [Edit] key.
‘Edit’ is displayed. ‘OutA’ flashes.
-
Select 'Anlg' with the [A] or [B] key.
-
Press the [Edit] key.
‘Out’ and ‘V’ flash alternately.
-
Set the parameter with the [A] or [B] key.
-
Press the [Edit] key.
The set value is saved.
The next adjustable parameter is shown.
Commissioning
-
Repeat steps 4 and 5 until all parameters are set.
-
Press the [Edit] key.
RUN mode is active.
7.3.6 Replicating parameters
Requirements:
- The previously configured sensor (master sensor) is ready for operation and is in RUN mode.
- The switching output on the device sensor is configured to PNP and is in an unswitched status; the 'OutA' indicator is off.
- The master sensor and device sensor have the same design with reference to the parameters, i.e. they have the same device ID.
–The master sensor is connected to the device sensor and the power supply.
- Parameterisation of the device sensor must not be blocked via IO-Link.
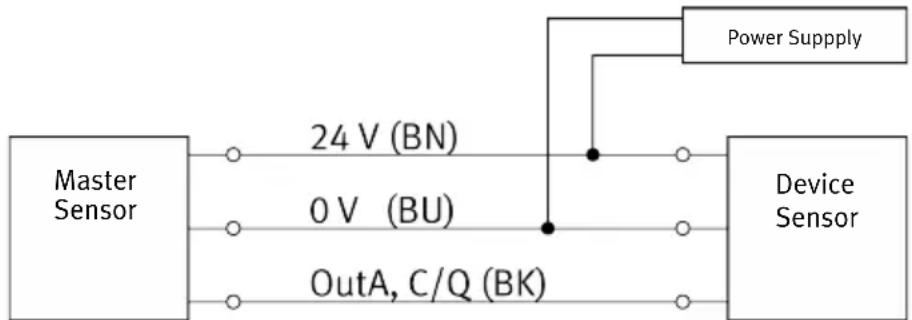
flowchart
graph LR
    A["Master Sensor"] -->|24 V (BN)| B["Device Sensor"]
    A -->|0 V (BU)| B
    A -->|OutA, C/Q (BK)| B
    B -->|Power Supply| A
Fig. 16: Replicate pin allocation parameters
- Select the 'Spec' special menu on the master sensor with the device settings.
- Press the [Edit] key repeatedly until 'MASt' is displayed.
- Select 'ON' with the [A] or [B] key.
- Press the [Edit] key.
‘REPL’ and ‘REdY’ are displayed alternately.
- Press the [A] or [B] key.
‘REPL’ and ‘RUN’ are briefly displayed alternately. The parameters are transmitted to the device sensor. ‘REPL’ and ‘REdY’ are displayed alternately.
In the event of an error, an error message is displayed → 10.1 Fault clearance, → 10.2 Error messages.
-
Repeat point 5 if an additional sensor is to be parameterised.
-
Press the [Edit] key.
The RUN mode is active.
7.3.7 Performing offset adjustment
Requirements:
-Operating pressure is present and there is no flow rate.
- The sensor is ready for operation and is in RUN mode.
- 'Z.AdJ' 'ON' is set → 7.3.3 Changing device settings.
-The measured value lies in the range 0l / min± 3% FS
- Press the [A] key, the [B] key and the [Edit] key simultaneously.
'OK' is displayed: the offset adjustment was successful.
'FAIL' is displayed: the offset adjustment was not successful. Check requirements.
i
If 'Z.AdJ' 'OFF' is set for a later time, the sensor uses the factory-set calibration values.
7.4 Teaching switching points in TEACH mode
i
If 'Lock' 'IOL' is shown on the display, the sensor is locked by IO-Link Device Access Lock and can only be configured via IO-Link.
i
The Teach process is the same for configuring the switching outputs for OutA and OutB. In the following, the process is described using the switching output OutA. The Teach function is only available for flow monitoring.
Requirement: the sensor is ready for operation and is in RUN mode.
- Enter the security code 7.3.1 Entering security code.
- Define the switching function in EDIT mode 7.3.2 Configuring the switching output.
- Apply signal value 1.
-
Press the [A] key and the [Edit] key.
The current signal value will then be adopted as the first teach point (TP1).
‘t-IN’ flashes. -
Apply signal value 2.
-
Press the [A] key and the [Edit] key.
The current signal value will then be adopted as the second teach point (TP2).
The RUN mode is active.
There is no timeout in the TEACH mode. The sensor only switches to RUN mode when the entire teach process has ended.
8 IO-Link interface description
8.1 General information, IO-Link
| Characteristics Specification | |
| Protocol version Device V1.1 | |
| Profile Smart Sensor Profile | |
| Function classes Binary data channel (BDC)Process data variable (PDV)IdentificationDiagnosticsTeach channel | |
| Communication mode COM2 (38.4 kbaud) | |
| SIO-Mode support Yes | |
| Port class A | |
| Process data length IN 3 bytes | |
| Process data content IN 2 bit BDC (flow monitoring)1 bit BDC (volume monitoring)14 bit PDV (measured flow rate value) | |
| Service data IN 32 bit volume measurement/mass measurement | |
| Min. cycle time 4 ms | |
| Data storage required < 0.5 KB | |
| Vendor ID 0x014D (333) | |
| Device ID | → Tab. 16 Device ID values |
Tab. 15: General IO-Link specification
| Device ID [dec] Device ID [hex] Order code | |
| 80 0x000050 SFAH-01U | |
| 81 0x000051 SFAH-05U | |
| 82 0x000052 SFAH-1U | |
| 83 0x000053 SFAH-5U | |
| 84 0x000054 SFAH-10U | |
| 85 0x000055 SFAH-50U | |
| 86 0x000056 SFAH-100U | |
| 87 0x000057 SFAH-200U | |
| 88 0x000058 SFAH-01B | |
| 89 0x000059 SFAH-05B | |
| 90 0x00005A | SFAH-1B |
| 91 0x00005B | SFAH-5B |
| 92 0x00005C | SFAH-10B |
| 93 0x00005D | SFAH-50B |
| 94 0x00005E SFAH-100B | |
| 95 0x00005F | SFAH-200B |
Tab. 16: Device ID values
8.2 Identification parameters
| Index Sub index | Access ^1) | Name Sample value String | length | ||
| 0x0010 0 | R Vendor | Text http://Name SFAID 803530 | sto Max. 32 | ||
| 0x0011 0 | Vendor | /www.festo.com 20 | |||
| 0x0012 0 | Product | H-10B-G18FS-PNLK- | PNVBA-M8 | Max. 64 | |
| 0x0013 0 | Product | 0 SFAH-01B-M8 Max. 64 | |||
| 0x0014 0 | Product | Text Number | Flow sensor for gas media | Max. 32 | |
| 0x0015 0 | Serial Number | 3S7PL9V6HHM | 11 | ||
| 0x0016 0 | Hardware | Revision | REV01 | 5 | |
| 0x0017 0 | Firmware | Revision | V51.2.13 | 8 | |
| 0x0018 | 0 | R/W | Application Specific Tag | *** | 32 |
| 0x2101 0 | R Part Number | 1234567 | 7 | ||
1) R = read, R/W = read and write
Tab. 17: Identification parameters
8.3 IO-Link default parameters
| Index Sub index | Access1) | Name Value | Format | ||
| 0x0002 0 | W | System | Command | → 8.4 IO-Link system com-mands | UIn-terger8 |
| 0x000C 0 | R/W | Device | Access Locks→ Tab. 19 Device Access Locks | 0 = unblocked1 = blocked | Record |
| 0x0020 0 | R Error | Count | 0 | UIn- | terger16 |
| 0x0024 0 | Device | Status | 0 | UIn- | terger8 |
| 0x0025 0 | Detailed | Device Status | status | → 8.11 IO-Link diagnostics Array of 3 byte records | |
| 0x0028 0 | Process | Data Input | → 8.9 Process data IN | Record | |
1) R = read, W = write, R/W = read and write
Tab. 18: IO-Link default parameters
| Bit no. Description | |
| 0 Lock write access to parameters | |
| 1 Lock data save, no effect | |
| 2 Lock entire parameterisation in EDIT mode and TEACH mode | |
| 3 Lock UI, not used | |
Tab. 19: Device Access Locks
8.4 IO-Link system commands
| Value [dec] | Value [hex] | Command Description | |
| 65 0x41 | SP1 Sing | e Value Teach Determines Teachpoint for | Setpoint SP1 |
| 66 0x42 | SP2 Sing | e Value Teach Determines Teachpoint for | Setpoint SP2 |
| 67 0x43 | SP1 Two | Value Teach TP1 Determines teach-in point | 1 for switching point SP1 |
| 68 0x44 | SP1 Two | Value Teach TP2 Determines teach-in point | 2 for switching point SP1 |
| 75 0x4B | Specific | Teach Device-specific teach-in | |
| 79 0x4F | Teach Cancel Cancels the Teach sequence | ||
| 128 | 0x80 Device reset | Device warm start | |
| 130 | 0x82 | Restore factory settings | Sets the factory settings operative again |
| 160 | 0xA0 Reset Min PDV | Minimal measured flow value reset | |
| 161 | 0xA1 Reset Max PDV | Maximal measured flow value reset | |
| 168 | 0xA8 | Adjust flow zero point | User defined flow zero point adjustment |
| 176 | 0xB0 | Reset volume recording/mass recording | Reset volume recording/mass recording in RECORDER mode. |
| 177 | 0xB1 Start/resume volume recording/mass recording | Start or resume volume/mass logging in RECORDER mode. | |
| 178 | 0xB2 | Pause volume recording/mass recording | Pause volume recording/mass recording in RECORDER mode. |
Tab. 20: IO-Link system commands
8.5 Smart sensor profile parameters
| Index Subindex | Access1) | Name Value Format | |||
| 0x000D 0 | R Profile | Characteristics - Array of | UIn- teger16 | ||
| 1 Device | Profile ID | 0x0001: Smart Sensor Profile UIn- | teger16 | ||
| 2 Function | Class ID | 0x8000: Identifikation | |||
| 3 Function | Class ID | 0x8001: Binarer Datenkanal | (BDC) | ||
| 4 Function | Class ID | 0x8002: Prozessdatenvariable | (PDV) | ||
| 5 Function | Class ID | 0x8003: Diagnose | |||
| 6 Function | Class ID | 0x8004: Teach Channel | |||
| 0x000E 0 | PD Input Descriptor | - Array of | Octet- String3 | ||
| 1 BDC1, BDC2, BDC3 | 0x01, 0x03, 0x00 Octet- | String3 | |||
| 2 Process data variable | 0x02, 0x0E, 0x08 | ||||
| 0x003A | 0 | R/W | Teach Channel | 0: BDC1 (OutA), factory setting1: BDC1 (OutA)2: BDC2 (OutB) | UIn- teger8 |
| 0x003B | 0 R Teach State flagTP2 for 1 teach flag TP1 for 2 teach flag TP2 for 3 teach flag TP1 for 4 teach flag TP1 for 5 Teach State | 0 | Record | ||
| SP2 0: not set | 1: set | Boo- leanT | |||
| for SP2 0: not set | 1: set | ||||
| for SP1 0: not set | 1: set | ||||
| for SP1 0: not set | 1: set | ||||
| for SP1 0: not set | 1: set | ||||
| 0 | UIn- | teger4 | |||
| BDC1, flow rate monitoring OutA | |||||
| 0x003C 1 | R/W Setpoint SP1 | 1 ... 16382 UIn- | teger16 | ||
| 2 Setpoint SP2 1 | ... 16382 | ||||
| 0x003D 1 | Switchpoint logic | 0: NO | 1: NC | UIn-teger8 | |
| 2 Switchpoint mode | 1: Single point mode | 2: Window mode128: auto difference moni-toring | |||
| 3 Setpoint Hysteresis | 0 ... 7373 UIn- | teger16 | |||
| BDC2, flow rate monitoring OutB | |||||
| 0x003E 1 | R/W Setpoint SP1 | 1 ... 16382 UIn- | teger16 | ||
| 2 Setpoint SP2 1 | ... 16382 | ||||
| 0x003F | 1 Switchpoint logic | 0: NO | 1: NC | UIn-teger8 | |
| 2 Switchpoint mode | 1: Single point mode | 2: Window mode128: auto difference moni-toring | |||
| 3 Setpoint Hysteresis | 0 ... 7373 UIn- | teger16 | |||
| BDC3, volume pulse/mass pulse (Puls) | |||||
| 0x4000 1 | R/W Setpoint | 164 ... 42949 | 67295 UIn- | teger32 | |
| 2 no used | 0 | ||||
| 0x4001 1 | Switchpoint logic | 0: NO | 1: NC | UIn-teger8 | |
| 2 Switchpoint mode | 128: volume pulse/mass | pulse | |||
| 3 no used | 0 | UIn- | teger16 | ||
1) R = read, R/W = read and write
Tab. 21: Smart sensor profile parameters
8.6 Device-specific parameters
| Index Sub-Index | Access1) | Name Value Format | |||
| 0x0112 0 | R/W OutA, auto difcereAuto differen | ference moni-toring, max. signal change (S.obS) | 16 ... 328, Factory setting: 33 | UInteger16 | |
| 0x0113 0 | OutA, auto differen | nce moni-toring, period (t.obS) | 5 ... 9999 | ||
| 0x0114 0 | OutA, auto differen | nce moni-toring, monitoring range (d.SP) | 41 ... 4096 | ||
| 0x0118 0 | OutA, backlight co | lor (COLR) 0: always blue | 1: red, if Out = 02: red, if Out = 1 | ||
| 0x0130 0 | OutB, auto differen | nce moni-toring, max. signal change (S.obS) | 16 ... 328, Factory setting: 33 | ||
| 0x0131 0 | OutB, auto differen | nce moni-toring, period (t.obS) | 5 ... 9999 | ||
| 0x0132 0 | OutA, auto differen | nce moni-toring, monitoring range (d.SP) | 41 ... 4096 | ||
| 0x0136 0 | OutB, backlight co | lor (COLR) 0: always blue | 1: red, if Out = 02: red, if Out = 1 | ||
| 0x0149 0 | Volume pulse/ma | ss pulse width (PULS/MSEC) | 20 ... 995 ms | ||
| 0x016A 0 | Analog output sca | ling, start value (In.Lo) | -100 ... 80 Integer16 | ||
| 0x016B 0 | Analog output sca | ling, end value (In.Hi) | -80 ... 100 | ||
| 0x016C 0 | Analog output type | (Out) 0: 0 ... 10 V voltage out | 1: 1 ... 5 V voltage output2: 4 ... 20 mA current output | UInteger16 | |
| 0x017F 0 | R/W flow unit of the display (FLOW/Unit) | 0: l/min1: l/h2: scfm3: scfh4: g/min | UInteger16 | ||
| 0x0181 0 | Flow display filter | 8: 256 ms | 9: 512 ms10: 1024 ms | ||
| 0x0182 0 | Filter measured flow | w rate value PDV (AVER) | 0: filter off1: 2 ms2: 4 ms3: 8 ms4: 16 ms5: 32 ms6: 64 ms7: 128 ms8: 256 ms9: 512 ms10: 1024 ms11: 2048 ms | ||
| 0x0184 0 | User zero adjustment on/off (Z.Adj) | 0: off1: on | |||
| 0x01DD 0 | Measured value display 1: flow rate | 2: volume pulse/mass pulse | |||
| 0x01E2 0 | Output signal at pin Y 2) | 0: OutB (bin)1: analogue output for the flow rate signal (Anlg) | |||
| 0x01E3 0 | Output signal at pin X 3) | 0: OutA (FLOW)1: volume pulse/mass pulse (VOL/MASS) | |||
| 0x01E8 0 | R/W Backlight duration | ation(Eco/SEC) | 0: always on1: 5 s2: 10 s3: 20 s4: 40 s5: 80 s6: 160 s7: 320 s8: 640 s | UInteger16 | |
| 0x01E9 0 | Sub-display mode | (Sub.d) 0: units | 1: bar graph2: gas3: flow direction)4: SP15: SP26: d.SP | ||
| 0x01EA 0 | Lock code, local parameter | parameterlock | 0: off1 ... 9999 - code | ||
| 0x01EE 0 | Gas type (GAS) 0: air | air | 1: N23: Ar | ||
| 0x01F0 0 | Reference condition for volume values (REF/Cond) | volume values (REF/Cond) | 0: 0 °C1: 15 °C2: 20 °C | ||
| 0x2001 0 | R PDV, measured flow rate process value | flow rateprocess value | 0 ... 2^14 -1 | ||
| 0x2002 0 | PDV, process value of volumemeasurement/mass measurement for pulse output | of volumemeasurement/mass measurement in RECORDER mode | 0 ... 2^32 -1 UInteger32 | ||
| 0x2004 0 | PDV, process value of volumemeasurement/mass measurement in RECORDER mode | of volumemeasurement/mass measurement in RECORDER mode | 0 ... 2^32 -1 | ||
| 0x2005 0 | Min. PDV, minimum measured flow rate value | minimum measured flow rate value | 0 ... 2^14 -1 UInteger16 | ||
| 0x2006 0 | Max. PDV, maximum measured flow rate value | maximum measured flow rate value | 0 ... 2^14 -1 | ||
| Index Sub-Index | Access ^1) | Name Value Format | |||
| 0x200E 0 | R Runtime | of volume of volume | measure-ment since last reset/power on | 0 ... 2^32 - 1 s UInteger32 | |
| 0x200F 0 | Runtime | measurement in error status of flow rate measurement since last reset/power on | 0 ... 2^32 - 1 s | ||
1) R = read, R / W = read and write
2) Pin 2 for SFAH-...-M8; Pin 3 for SFAH-...-L1
3) Pin 4 for SFAH-...-M8; Pin 2 for SFAH-...-L1
Tab. 22: Device-specific parameters
8.7 IO-Link teach-in
The sensor support three different IO-Link teach-in functions for all IO-Link switching channels (BDC):
-Device-specific teach-in
- Single Value teach-in according to IO-Link specification in window mode and in auto difference monitoring
- Two Value teach-in according to IO-Link specification in single-point mode
Carry out the following steps before teach-in:
- Configure the switching channel according to the application including switching point mode, switching logic and hysteresis.
- Set the teach-in channel to the desired switching channel (parameter 0x003A, OutA=0x01, OutB=0x02).
The following applies to all teach-in processes:
- The [A], [B] and [Edit] keys are locked during teach-in. 't-IN' and 'IOL' flash alternately on the display.
- The chronological sequence of the teach-in points is not relevant.
–The teach values are only accepted after the second teach-in. - The teach-in process can be cancelled with the 0x4F command.
Device-specific teach-in
The device-specific teach-in (0x4B) behaves in the same way as the manual teach-in on the device. The two teach-in points are set with the IO-Link command instead of a manual key press. For teach-in of the single-point mode the switching point is derived from the average of the two teach-in points: SP = 1/2 (TP1 + TP2).
- Set the first flow rate.
- Send the teach-in command 0x4B.
- Set the second flow rate.
- Send the teach-in command 0x4B.
Single Value Teach-In according to IO-Link specification in window mode
SP1 and SP2 are taught-in with separate commands with the Single Value teach-in. The two teach points are assigned to the switching points SP1 and SP2 in such a way that the parameter set is valid.
- Set the desired flow rate.
- Send the teach-in command 0x41 for TP1.
- Set the second desired flow rate.
- Send the teach-in command 0x42 for TP2.
Two Value teach-in according to IO-Link specification in single-point mode
With the Two Value teach-in, each teach point is taught in with separate commands for SP1.
- Set the desired flow rate.
- Send the teach-in command 0x43 (SP1 Two Value Teach TP1).
- Set the second desired flow rate.
- Send the teach-in command 0x44 (SP1 Two Value Teach TP2). The switching point is derived from the average of the two teach points: SP1 = 1/2 (TP1 + TP2).
Recommendation: after teach-in read out and check that the setting conform to the application. For more information see IO-Link Smart Sensor Profile → 8.5 Smart sensor profile parameters.
8.8 Block parameterisation
This function can prevent sending of invalid parameters to a device. Individually sent parameter values may not be compatible with the parameter values already stored in the device. All parameters transmitted as a block will be simultaneously accepted and activated.
Block parametrisation for BDC1 (OutA)
| Index Sub | index | Name |
| 0x003C 1 Setpoint SP1 | ||
| 2 Setpoint SP2 | ||
| 0x003D 2 Switchpoint mode (Fctn) | ||
| 3 Hysteresis (HY) | ||
| 0x0112 0 Auto difference monitoring, max. signal change (S.obS) | ||
| 0x0113 0 Auto difference monitoring, period (t.obS) | ||
| 0x0114 0 Auto difference monitoring, signal change (d.SP) |
Tab. 23: Block of coherent OutA parameters
Block parametrisation for BDC2 (OutB)
| Index Sub | index | Name |
| 0x003E 1 Setpoint SP1 | SP1 | |
| 2 Setpoint SP2 | ||
| 0x003F 2 Switchpoint mode (Fctn) | nt mode (Fctn) | |
| 3 Hysteresis (HY) | ||
| 0x0130 0 Auto difference monitoring, max. signal change (S.obS) | ||
| 0x0131 0 Auto difference monitoring, period (t.obS) | ||
| 0x0132 0 Auto difference monitoring, signal change (d.SP) | ||
Tab. 24: Block of coherent OutB parameters
Block parametrisation for BDC3 (Puls)
| Index Sub | index | Name |
| 0x4000 1 Setpoint SP1 | ||
| 0x0149 0 Volume pulse/mass | pulse width |
Tab. 25: Block of coherent pulse parameters
Block parametrisation for the analogue output
| Index Sub | index | Name |
| 0x016A 0 Analog output scaling, start value (In.Lo) | ||
| 0x016B 0 Analog output scaling, end value (In.Hi) | ||
Tab. 26: Block of coherent parameters for the analogue output
8.9 Process data IN
| Bit 23 22 21 20 19 | 18 17 | 16 15 | 14 1 | 13 12 | 11 10 | 9 8 | ||||||||||
| Meaning no used M | SB LSB | |||||||||||||||
| Process data PDV flow rate | ||||||||||||||||
| Data content 14 bit | PDV measured value | |||||||||||||||
| Index 0x0028 | ||||||||||||||||
| SubIndex | 1 | |||||||||||||||
| Data type | UInteger14 | |||||||||||||||
Tab. 27: Process data IN PDV
| Bit 7 6 5 4 3 2 1 0 | ||||||||
| Process data | no used | BDC3 | BDC2 | BDC1 | ||||
| Data content | Puls | OutB | OutA | |||||
| Index | 0x0028 | |||||||
| SubIndex no used 2 | 34 | |||||||
| Data type Boolean | ||||||||
Tab. 28: Process data IN BDC
8.10 Conversion factors
Fixed conversion factors are required for the physical units in order to display the measured and process value-related parameters correctly in the control unit. The conversion factors for the volume units are based on the reference standard DIN 1343 and the gas medium air.
• For other reference standards and gas media, use factors from the following chapters:
- → 4.2.4 Standard switching condition for volume values - 'REF'/'Cond'
- → 8.10.4 Scaling factors for gases
8.10.1 Conversion factors for process data variable, process data variable min, process data variable max, and setpoint values SP1, SP2
| Flow rate unit | SFAH-0.1 SFAH-0.5 | |||
| Gradient Offset Gradient Offset | ||||
| l/min 0.00 | 0012207776 -0.1 | 0.000061 | 038882 -0.5 | |
| l/h | 0.000732466581 -6 | 0.00 | 3662332906 -30 | |
| scft/min | 0.000000431114 -0.0 | 0353147 | 0.00 | 0002155570 -0.01765735 |
| scft/h | 0.000025866838 | -0.2118882 | 0.000129334188 | -1.059441 |
| g/min | 0.000015783434 | -0.12929 | 0.00007891717 | -0.64645 |
Tab. 29: Conversion factors
| Flow rate unit | SFAH-1 | SFAH-5 | ||
| Gradient Offset Gradient Offset | ||||
| l/min 0.00 | 0122077764 -1.0 | 0.00 | 0610388818 -5.0 | |
| l/h | 0.007324665812 | -60 | 0.036623329061 | -300 |
| scft/min | 0.000004311140 | -0.03531470 | 0.000021555698 | -0.1765735 |
| scft/h | 0.000258668376 | -2.118882 | 0.001293341879 | -10.59441 |
| g/min | 0.00015783434 | -1.2929 | 0.000789171702 | -6.4645 |
| Flow rate unit | SFAH-10 SFAH-50 | |||
| Gradient Offset Gradient Offset | ||||
| l/min 0.00 | 1220777635 -10 0.006 | 103888177 -50 | ||
| l/h 0.0732 | 46658121 -600 0.3662 | 33290606 -3000 | ||
| scft/min 0. | 000043111396 -0.353 | 14700 0.00021555698 | 0 -1.76573500 | |
| scft/h 0.00 | 2586683758 -21.1888 | 2 0.012933418788 -105.9441 | ||
| g/min 0.00 | 1578343405 -12.929 | 0.007891717024 -64.645 | ||
Tab. 30: Conversion factors
Tab. 31: Conversion factors
| Flow rate unit | SFAH-100 | SFAH-200 | ||
| Gradient Offset Gradient Offset | ||||
| l/min 0.01 | 2207776354 -100 | 0.024415 | 552707 -200 | |
| l/h 0.7324 | 66581212 -6000 | 1.46493316 | 2424 -12000 | |
| scft/min 0. | 000431113960 -3.531 | 47000 | 0.0008 | 62227919 -7.06294000 |
| scft/h 0.02 | 5866837576 -211.888 | 2 0.051733675151 -4 | 23.7764 | |
| g/min 0.01 | 5783434047 -129.29 | 0.031566868095 -258 | 58 | |
Tab. 32: Conversion factors
8.10.2 Conversion factors for hysteresis, switching point d.SP and max. signal delta (S.obS)
| Flow rate unit | SFAH-0.1 | SFAH-0.5 | SFAH-1 | |||
| Gradient | O^1) | Gradient | O^1) | Gradient | O^1) | |
| l/min | 0.000012207776 | 0 | 0.000061038882 | 0 | 0.000122077764 | 0 |
| l/h | 0.000732466581 | 0 | 0.003662332906 | 0 | 0.007324665812 | 0 |
| scft/min | 0.000000431114 | 0 | 0.000002155570 | 0 | 0.000004311140 | 0 |
| scft/h | 0.000025866838 | 0 | 0.000129334188 | 0 | 0.000258668376 | 0 |
| g/min | 0.000015783434 | 0 | 0.00007891717 | 0 | 0.00015783434 | 0 |
1) Offset
Tab. 33: Conversion factors
| Flow rate unit | SFAH-5 | SFAH-10 | SFAH-50 | |||
| Gradient | O^1) | Gradient | O^1) | Gradient | O^1) | |
| l/min | 0.000610388818 | 0 | 0.001220777635 | 0 | 0.006103888177 | 0 |
| l/h | 0.036623329061 | 0 | 0.073246658121 | 0 | 0.366233290606 | 0 |
| scft/min | 0.000021555698 | 0 | 0.000043111396 | 0 | 0.000215556980 | 0 |
| Flow rate unit SFAH-5 SFAH-10 SFAH-50 | ||||||
| Gradient O | 1) | Gradient O | 1) | |||
| scft/h 0.001293 | 341879 0 0.00258668 | 3758 | 0 0.012933418788 0 | |||
| g/min 0.000789 | 171702 0 0.00157834 | 3405 | 0 0.007891717024 0 | |||
1) Offset
Tab. 34: Conversion factors
| Flow rate unit SFAH-100 SFAH-200 | ||||
| l/min 0.012207776354 | 0 | 0.0244155 | 52707 | 0 |
| l/h | 0.732466581212 | 0 | 1.464933162424 | 0 |
| scft/min | 0.000431113960 | 0 | 0.000862227919 | 0 |
| scft/h | 0.025866837576 | 0 | 0.051733675151 | 0 |
| g/min | 0.015783434047 | 0 | 0.031566868095 | 0 |
Tab. 35: Conversion factors
8.10.3 Conversion factors for volume units and mass units
| Variant | Volume units and mass units | |||
| l | scft | g | ||
| SFAH-0.1 | G^1) | 0.000006103888 | 0.000000215557 | 0.000007891717 |
| O^2) | 0 | 0 | 0 | |
| SFAH-0.5 | G | 0.000030519441 | 0.000001077785 | 0.000039458585 |
| O | 0 | 0 | 0 | |
| SFAH-1 | G | 0.000061038882 | 0.000002155570 | 0.000078917170 |
| O | 0 | 0 | 0 | |
| SFAH-5 | G | 0.000305194409 | 0.000010777849 | 0.000394585851 |
| O | 0 | 0 | 0 | |
| SFAH-10 | G | 0.000610388818 | 0.000021555698 | 0.000789171702 |
| O | 0 | 0 | 0 | |
| SFAH-50 | G | 0.003051944088 | 0.00010777849 | 0.003945858512 |
| O | 0 | 0 | 0 | |
| SFAH-100 | G | 0.006103888177 | 0.00021555698 | 0.007891717024 |
| O | 0 | 0 | 0 | |
| Variant Volume units and mass units | ||||
| l scft g | ||||
| SFAH-200 G 0.012207 | 776354 0.00043111396 0.015783434047 | |||
| O O O O | ||||
1) G = gradient
2) 0 = offset
Tab. 36: Conversion factors for volume units and mass units
8.10.4 Scaling factors for gases
| Gas Factor | |
| Compressed air 1 | |
| Nitrogen (N2) 0.987 | |
| Argon 1 |
Tab. 37: Scaling factors for gases
8.11 IO-Link diagnostics
| Event code | Event type | Device status | Local display | Possible cause |
| 0x1802 | Error | Failure | ‘Er02’‘ASIC’ | IO-Link- driver error |
| 0x1803 | Error | Failure | ‘Er03’‘SEnS’ | – Sensor unit failure– Device faulty |
| 0x1809 | Warning | Out-of-Specifica-tion | Measured value ‘Er09’/‘UNdR’ | Range of flow sensing undershot |
| 0x180A | Warning | Out-of-Specifica-tion | Measured value ‘Er10’/‘OVER’ | Range of flow sensing undershot |
| 0x1815 | Error | Out-of-Specifica-tion | Measured value ‘Er21’/‘SHRt’ | Overload or short circuit at switching output OutA/pulse |
| 0x1816 | Error | Out-of-Specifica-tion | Measured value ‘Er22’/‘SHRt’ | Overload or short circuit at switching output OutB |
| 0x181F | Notification De | vice is operating properly | no effect | Volume recording/mass recording overflow |
| 0x4000 | Error | Failure | Measured value ‘Er20’/‘tEMP’ | Temperature error in IO-Link driver |
| Event code | Event type Device status Local display Possible cause | |||
| 0x5000 Error Failure ‘Er01’ | ‘FAIL’ | Device hardware fault | ||
| 0x5111 Warning Out-of-Specification | Measured value ‘Er17’/‘SUPL’ | Power supply too low | ||
Tab. 38: IO-Link diagnostics
9 Operation
9.1 Switching on the Sensor
After switching on the supply voltage, the sensor requires a warm-up time of 10 minutes before it reaches the specified accuracy. The flow rate displayed by the sensor refers to the standard conditions that have been set in the SPEC menu under Options.
9.2 Restoring factory settings (Restore)
i
The current settings of the sensor will be lost if factory settings are restored.
- Switch off the operating voltage.
- Press and hold the [A] and [B] keys.
- Switch on the operating voltage.
- Also press the [Edit] key.
‘RSto PArM’ is displayed.
All parameters are reset to the factory settings.
10 Malfunctions
10.1 Fault clearance
Troubleshooting communication interface → 8.11 IO-Link diagnostics
| Malfunction Cause Remedy | ||
| No display No operating voltage or impermissible operating voltage. | Apply permissible operating voltage. | |
| Electrical connections swapped. Connect the device in accordance with the circuit diagram. | ||
| Device faulty. Replace device. | ||
| Economy mode set. Press key or switch off economy mode. | ||
| Indicator or switching output does not react as expected | Short circuit or overload at the output. | Eliminate short circuit or overload. |
| Incorrect switching point taught, e.g. at 0 l/min. | Repeat teach-in. | |
| Incorrect standard condition for volumetric flow rate set. | Correct standard condition. | |
| Device faulty. Replace device. | ||
| Parameter incorrect. Reset to factory settings. | ||
Tab. 39: Fault clearance
10.2 Error messages
| Fault description Cause Remedy | ||
| ‘Er01’/‘FAIL’ ^1) | Device faulty Replace device. | |
| ‘Er02’/‘ASIC’ ^1) | ||
| ‘Er03’/‘SEnS’ ^1) | ||
| ‘Er09’/‘UndR’ Below sensing range | Maintain sensing range. | |
| ‘Er10’/‘OVER’ Sensing range exceeded | Maintain sensing range. | |
| ‘Er17’/‘SUPL’ ^2) | Undervoltage Maintain permissible operating voltage. | |
| ‘Er20’/‘t.Hi’ ^2) | Temperature fault Check operating conditions. | |
| ‘Er21’/‘SHRt’ ^2) | Short circuit at OutA/“Puls” Eliminate short circuit. | |
| ‘Er22’/‘SHRt’ ^2) | Short circuit at OutB Eliminate short circuit. | |
| ‘Err’/‘bUSY’ | OutA/“Puls” is switched active in the device sensor | Check device settings. |
| ‘Err’/‘Id’ | Device ID error, devices do not have the same design | Use sensors with the same flow rate measurement range (same device ID) for replicating. |
| ‘Err’/‘COM’ IO-Link communication error Check settings of the device | sensor. | |
| Check line. | ||
1) Display flashes red
2) Display is red
Tab. 40: Error messages
11 Removal
- Turn off energy source and compressed air.
- Disconnect connections from the sensor.
- Loosen the mountings.
12 Technical data
12.1 Technical data, general
General
| Certification RCM compliance mark, c UL | us Listed (OL) |
| Certificates, declaration of conformity | → www.festo.com/sp |
| Note on materials RoHS-compliant |
Tab. 41: General
Input signal and measuring element
| Measured variable | - Volumetric flow rate- Mass flow rate | |
| Flow direction | - Unidirectional- Bidirectional | |
| Measurement principle Thermal | ||
| Measurement method Heat transfer | ||
| Warm-up time [min] 10 | ||
| Operating pressure | [MPa] | -0.09 ... 1 |
| [bar] | -0.9 ... 10 | |
| [psi] | -13 ... 145 | |
| Temperature of medium | [°C] | 0 ... 50 |
| Ambient temperature | [°C] | 0 ... 50 |
Input signal and measuring element
| Operating medium | - Compressed air to ISO 8573-1:2010 [6:4:4] - Nitrogen - Argon |
| Nominal conditions for determination of the accuracy specification. | - Operating pressure at output: 0 kPa relative - Medium and ambient temperature: 23°C - Analogue output: voltage with 20 kΩ load - Switching output: load current in the switched status 5 mA - Mounting position: horizontal, display upwards - Inflow: → 6.1.1 Infeed situation |
Tab. 42: Input signal and measuring element
| Output, general | |
| Accuracy of zero point com- [% FS] ± 1pressed air, nitrogen | |
| Accuracy of zero point argon [% FS] ± 2 | |
| Repetition accuracy of zero [% FS] ± 0.2point | |
| Repetition accuracy of spread [% FS] ± 0.8 | |
| Temperature coefficient zero [% FS/K] Typ. 0 (max. 0.05)point | |
| Temperature coefficient of [% FS/K] Typ. 0.15 (max. 0.3)spread | |
| Position dependency of zero [% FS/point with vertical mounting 100 kPa] | ± 0.5 |
| Accuracy of spread | |
| - Without using the com- [% FS] ± 2pressed air, nitrogen flow outlet | |
| - Without using the argon [% FS] ± 4flow outlet | |
| - With use of the com- [% FS] ± 3.5pressed air, nitrogen cur-rent outlet | |
| - With use of the argon flow [% FS] ± 7outlet | |
Output, general
| Pressure influence of spread | ||
| - In the pressure range -70 ... +1000 kPa | [% FS] Typ. ± 1 | |
| - In the pressure range -90 ... - 70 kPa | [% FS] Typ. ± 4 | |
Tab. 43: Output, general
Switching output
| Switching output 2 PNP or 2 NPN, switchable | |
| Switching function Threshold value comparator, window comparator, auto difference monitoring | |
| Switching element function N/C contact or N/O contact, switchable | |
| Max. output current [mA] 100 | |
| Voltage drop [V] Max. 1 | |
| Max. switch-on time [ms] 6 (at Filt = OFF) | |
| Max. switch-off time [ms] 5 (at Filt = OFF) | |
| Pull down resistor [ms] PNP: integrated | |
| Pull-up resistor [ms] NPN: not integratedLoad current of at least 2 mA required | |
| Inductive protective circuit | Present |
Tab. 44: Switching output
| Analogue output | Variant | SFAH-...U- | SFAH-...B |
| Characteristic flow rate curve [l/min] | -0.1...- | 0 ... 0.1 | -0.1 ... 0.1 |
| -0.5...- | 0 ... 0.5 | -0.5 ... 0.5 | |
| -1...- | 0 ... 1 | -1 ... 1 | |
| -5...- | 0 ... 5 | -5 ... 5 | |
| -10...- | 0 ... 10 | -10 ... 10 | |
| -50...- | 0 ... 50 | -50 ... 50 | |
| -100...- | 0 ... 100 | -100 ... 100 | |
| -200...- | 0 ... 200 | -200 ... 200 | |
| Voltage output characteristic [V] All 0 ... curve | 10 or 1 ... 5 | ||
| Analogue output Variant SFAH-...U- SFAH-...B | |||
| Current output characteristic [mA] All 4 curve ... 20 | |||
| Max. load resistance of current output [Ω] All 500 | |||
| Min. load resistance of voltage output [kΩ] All 20 | |||
| Rise time [ms] All Max. 3 (with Filt = Off) | |||
Tab. 45: Analogue output
| Output, additional data | |
| Short circuit current rating Yes | |
| Overload protection Present | |
Tab. 46: Output, additional data
| Electronics | |
| Operating voltage range [V DC] 22 ... | 26 |
| Max. no-load supply current [mA] 25 | |
| Reverse polarity protection | For all electrical connections |
Tab. 47: Electronics
| Electromechanics | SFAH-...-M8 | SFAH-...-L1 |
| Connection type | Plug | |
| Connection technology | M8x1 A-cod., according to EN 61076-2-104 | Plug pattern L1J |
| Number of pins/wires | 4 | |
| Max. connecting cable length [m] | 3020 with IO-Link operation | |
Tab. 48: Electromechanics
| Mechanics | |
| Mounting position | Any |
| Pneumatic connection | → Tab. 12 Effect of the infeed conditions and port sizes on the specified accuracy |
| Product weight [g] | Approx. 90 |
Mechanics
| Note on materials for housing | PA-reinforced |
| Materials in contact with medium | - NBR- PA-reinforced- High-alloy stainless steel- Anodised wrought aluminium alloy- Silicon- Silicon nitride- Epoxy |
Tab. 49: Mechanics
Display, operation
| Displayable units for the variants- SFAH-0.1- SFAH-0.5- SFAH-1 | l/min, l/h, scft/h, g/min, l, scft, g |
| Displayable units for the variants- SFAH-5- SFAH-10 | l/min, l/h, scft/min, scft/h, g/min, l, scft, g |
| Displayable units for the variants- SFAH-50- SFAH-100- SFAH-200 | l/min, scft/min, scft/h, g/min, l, scft, g |
| Setting range of volume threshold values for the variant-SFAH-0.1 | - 0.001 ... 9.999 l- 0.001 ... 9.999 sft3- 0.001 ... 9.999 g |
| Setting range of volume threshold values for the variants-SFAH-0.5-SFAH-1 | - 0.01 ... 99.99 l- 0.001 ... 9.999 sft3- 0.01 ... 99.99 g |
| Setting range of volume threshold values for the variant-SFAH-5 | - 0.1 ... 999.9 l- 0.001 ... 9.999 sft3- 0.1 ... 999.9 g |
| Setting range of volume threshold values for the variant-SFAH-10 | - 0.1 ... 999.9 l- 0.01 ... 99.99 sft3- 0.1 ... 999.9 g |
Display, operation
| Setting range of volume threshold values for the variant-SFAH-50 | - 1 ... 9999 l- 0.01 ... 99.99 sft3- 1 ... 9999 g |
| Setting range of volume threshold values for the variants-SFAH-100-SFAH-200 | - 1 ... 9999 l- 0.1 ... 999.9 sft3- 1 ... 9999 g |
| Zero range hiding [%FS] < 1.5 (Z.Adj = OFF) |
Tab. 50: Display, operation
| Flow rate measuring range [l/min] | -0.1 -0.5 | -1 -5 -10 | -50 -100 | -200 | ||||
| Start value 0.002 0.01 0.02 0.1 0.2 1 2 4 | ||||||||
| End value 0.1 0.5 1 5 10 50 | 100 | 200 | ||||||
Tab. 51: Flow rate measuring range unidirectional or bidirectional
| Flow rate measuring range [l/min] | -0.1B | -0.5B | -1B | -5B | -10B | -50B | -100B | -200B |
| Start value | -0.002 | -0.01 | -0.02 | -0.1 | -0.2 | -1 | -2 | -4 |
| End value | -0.1 | -0.5 | -1 | -5 | -10 | -50 | -100 | -200 |
Tab. 52: Flow rate measuring range bidirectional, supplementary
| Immission and emission | -0.1 -0.5 | -1 -5 | -10 | -50 | -100 | -200 | ||||
| Storage temperature [°C] | -20 ... 80 | |||||||||
| Degree of protection | IP40 | |||||||||
| Pressure drop at [kPa]600 kPa at input and q max. | < 0.5 | 1.2 1.5 | 1.6 | |||||||
| Pressure drop at 0 kPa [kPa]at output and q max. | < 0.5 | 7.5 10 | 30 | |||||||
| Standard nominal flow rate (600 -> 500 kPa) | 57 | 93 | 121 361 | 445 458 | 490 870 | |||||
Tab. 53: Immission and emission
12.2 Technical data for UL/CSA certification
Electrical data and ambient conditions for UL/CSA
| Rated supply voltage 24 V DC | |
| Input current max. 0.23 A | |
| Operating pressure max. 1.0 MPa | |
| Pollution degree 3 | |
| Humidity range 0 ... 93 % | |
| NEMA enclosure type number (Enclosure Type Rating) | UL Type 1 |
| Installation site for indoor use only | |
| Max. installation height 2000 m | |
| Degree of protection The degree of | protection IP40 is not UL-tested. |
Tab. 54: Electrical data and ambient conditions for UL/CSA
12.3 Examples for calculating the maximum error of the display
- Flow measuring range: 1 ... 50 l/min (FS = 50)
-Measured value: 35 l/min
Range error (2 % FS) Zero point error (1 % FS)
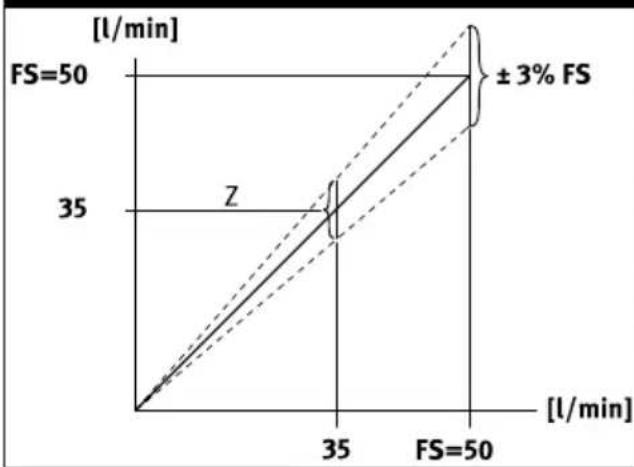
line
| FS | [l/min] | | ---- | ------- | | 50 | 35 | | 50 | ±3% |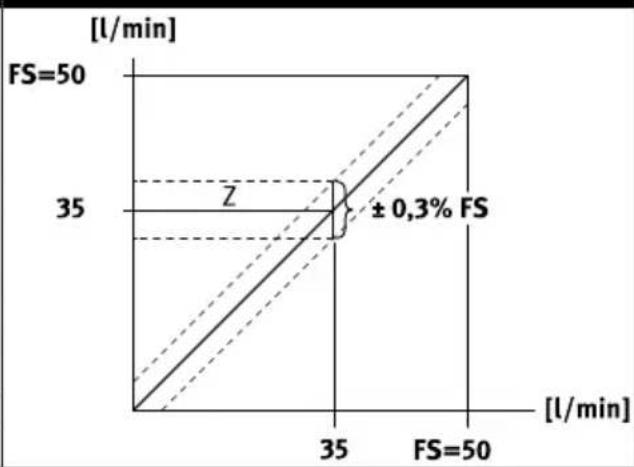
line
| Time [l/min] | FS Value | | ------------ | -------- | | 35 | 35 | | 50 | 50 |x= measured variable, y= measured value (display), z= maximum error of the display
Tab. 55: Spread error and zero point error
Spread error and zero point error
The spread error is proportional to the measured value. At the measured value of 35 l/min the spread error is 35/50 of 2% of 50 l/min = 0.7 l/min.
The zero point error is independent of the measured value. It is 1% of 50 l/min (FS) = 0.5 l/min.
Errors in the display under nominal conditions (0 bar relativ, 23 °C):
The display error under nominal conditions is the result of adding the spread and zero point errors.
Technical data
The actual flow rate is therefore in the range 35 ± (0.7 + 0.5) l/min = 35 ± 1.2 l/min.
Errors in the display under deviating nominal conditions (e.g. 6 bar relative, 40 °C, vertical mounting position and display at front):
Typical temperature errors and pressure errors are spread errors. The temperature error at 40 °C and measured value 35 l/min is 35/50 of 0.15% of 50 l/min * (40 °C - 23 °C) = ± 0.89 l/min.
The pressure error at 6 bar relative and measured value 35 l/min is 35/50 of 1% of 50 l/min = ±0.35 l/min.
The error due to position dependence is a zero point error. This error, with vertical mounting position and the front-facing display, is 35 l/min = 0.5% of 50 l/min * 6 = ±1.5 l/min for the measured value. The error of the display under deviating nominal conditions is derived from addition of the error values spread, zero point, temperature, pressure and mounting position.
The actual flow rate is in the range 35 ± (0.7 + 0.5 + 0.89 + 0.35 + 1.5) l/min = 35 ± 3.94 l/min.
Copyright:
Festo SE & Co. KG
Ruiter Straße 82
73734 Esslingen
Germany
Phone:
+49 711 347-0
- FESTO
- Table of contents
- Applicable documents.... 5
- Safety....5
- Additional information....6
- Product overview.... 6
- Assembly....16
- Installation.... 19
- Commissioning....21
- IO-Link interface description.... 27
- Operation.... 43
- Malfunctions....43
- Removal....45
- Technical data....45
- Applicable documents
- Safety
- Safety instructions
- Intended use
- Training of qualified personnel
- UL/CSA certification
- WARNING
- Additional information
- Product overview
- Structure
- Display components
- Symbols on the display
- Function
- Functional principle
- Operating statuses
- Switching outputs
- Switching functions
- Auto difference monitoring d\_[]
- Colour change of the display
- Volume pulse/mass pulse
- Standard switching condition for volume values - 'REF'/'Cond'
- Filter
- Analogue output
- Analogue signal
- Scaling of the analogue signal
- Minimum value and maximum value
- Replicate parameter function
- Offset adjustment
- Assembly
- NOTICE
- Mounting the sensor on the H-rail
- Mounting the sensor with wall mounting
- Mounting sensor on plate
- Mounting sensor on plate at the side
- Mounting sensor with front panel mounting kit
- Installation
- Pneumatic installation
- Installing tubing on sensor
- Infeed situation
- Electrical installation
- Risk of injury due to electric shock.
- Circuit diagram SFAH-...-L1
- Commissioning
- Switching on the sensor in RUN mode
- Switchover of measured value indicator
- Displaying parameters in SHOW mode
- Switching output OutA or volume pulse/mass pulse at the output
- Switching output OutB or analogue output Anlg
- Commissioning
- Configuring the sensor in EDIT mode
- Entering security code
- Configuring the switching output
- Changing device settings
- Setting the volume pulse output
- Setting the analogue output
- Replicating parameters
- Requirements:
- Performing offset adjustment
- Teaching switching points in TEACH mode
- IO-Link interface description
- General information, IO-Link
- IO-Link teach-in
- Device-specific teach-in
- Single Value Teach-In according to IO-Link specification in window mode
- Two Value teach-in according to IO-Link specification in single-point mode
- Block parameterisation
- Conversion factors
- Operation
- Switching on the Sensor
- Restoring factory settings (Restore)
- Malfunctions
- Fault clearance
- Removal
- Technical data
- Technical data, general
- Technical data for UL/CSA certification
- Examples for calculating the maximum error of the display
- Spread error and zero point error
- Errors in the display under nominal conditions (0 bar relativ, 23 °C):
- Technical data
- Errors in the display under deviating nominal conditions (e.g. 6 bar relative, 40 °C, vertical mounting position and display at front):
Brand : Festo
Model : SFAH-200U-G14FS-PNLK-PNVBA-M8
Category : Measurement