930XC-20C-UPC-SC - Câbles pour ordinateurs et périphériques Tempo - Free user manual and instructions
Find the device manual for free 930XC-20C-UPC-SC Tempo in PDF.

| Product Type | Fiber Optic Patch Cable |
| Model | 930XC-20C-UPC-SC |
| Connector Type | SC/UPC |
| Fiber Mode | Single-mode (OS2) |
| Wavelength | 1310nm / 1550nm |
| Insertion Loss | < 0.3 dB typical |
| Return Loss | > 50 dB |
| Cable Length | 20 meters |
| Jacket Material | LSZH (Low Smoke Zero Halogen) |
| Diameter | 3.0 mm |
| Operating Temperature | -20°C to +70°C |
| Storage Temperature | -40°C to +80°C |
| Bend Radius | 10 mm (static) / 20 mm (dynamic) |
| Connector Durability | 500 mating cycles |
| Standards Compliance | TIA/EIA-568-C.3, ISO/IEC 11801 |
| Cleaning | Use lint-free wipes and isopropyl alcohol |
| Warranty | Limited lifetime |
Frequently Asked Questions - 930XC-20C-UPC-SC Tempo
User questions about 930XC-20C-UPC-SC Tempo
0 question about this device. Answer the ones you know or ask your own.
Ask a new question about this device
Download the instructions for your Câbles pour ordinateurs et périphériques in PDF format for free! Find your manual 930XC-20C-UPC-SC - Tempo and take your electronic device back in hand. On this page are published all the documents necessary for the use of your device. 930XC-20C-UPC-SC by Tempo.
USER MANUAL 930XC-20C-UPC-SC Tempo
natural_image
Abstract black logo design resembling a stylized 'T' or T-shape (no text or symbols)TEMPO®
COMMUNICATIONS
text_image
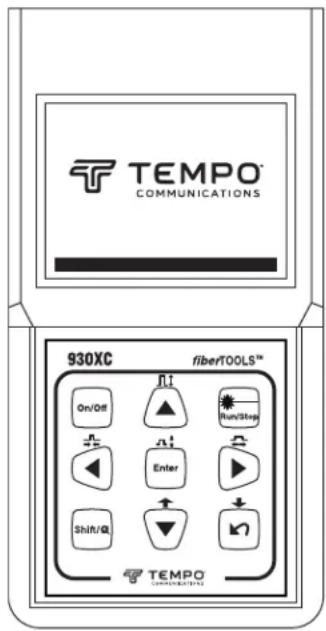
TEMPO COMMUNICATIONS 930XC fiber/TOOLS™ On/Off Run/Stop Enter Shift/Q TEMPO COMMUNICATIONSC€
FC
930XC-20C • 930XC-20M
930XC-30F • 930XC-30P
Handheld OTDRs

natural_image
Black triangular warning symbol with exclamation mark (no text or numbers)Read and understand all of the instructions and safety information in this manual before operating or servicing this tool.
Table of Contents
Preface 5
Description....5
Safety....5
Purpose of This Manual 5
Warranty....5
Important Safety Information 6
Section 1. Introduction 9
Section 2. Basic Operation 10
Instrument Interface Description 10
Use of Batteries 10
Auto Off Mode....10
Recharging....10
Keypad Functions 11
Section 3. Basic OTDR Information 12
Principle of OTDRs....12
Basic Definition and Classification of Events 12
Reflection Events....12
Non-reflection Events.... 12
Inspection of Events 12
Measurement Application....13
Measurement Contents.... 13
Trace Analysis....13
Trace Display Screen....13
Trace Display Window....13
Information Window 14
Measurement Trace Parameters.... 14
Events List....14
Marker A/B Information....15
Fiber Information 15
Menu Bar and Icons....16
Parameter Configuration 16
Definitions of Measurement Parameters.... 17
Range Configuration....17
Pulse Width Configuration.... 18
Average Time Configuration.... 18
Wavelength Configuration....18
Measurement Mode Configuration 19
Power Meter, Laser Source, and VFL Configuration.... 19
Length Units 20
Index of Refraction (IOR) Configuration 20
Scatter Coefficient Configuration.... 20
Non-reflection Threshold Configuration 21
Reflection Threshold Configuration.... 21
End Threshold Configuration.... 22
Delete File....22
Format Memory....23
Time Configuration.... 23
Auto Off Configuration.... 23
Language Configuration.... 24
Contrast Adjustment of LCD.... 24
Color Mode Setting.... 24
Default Setting 25
Help 25
Battery Recharge Status 26
Section 4. Trace Measurement and Processing of Existing Traces 27
Graphical User Interface (GUI) Instructions 27
Trace Measurement 27
Setup 28
Auto Trace Measurement 28
Manual Trace Measurement 29
Live Traffic Warning 29
Reasons for Trace Measurement Failures.... 29
Information Window....29
Switching between Information Window Items 29
Reviewing Events List 29
Reviewing Marker A/B Information 29
Switching between Marker A/B 29
Information between Marker A/B 30
Zoom a Trace.... 30
Zoom out Trace Horizontally 30
Zoom in Trace Horizontally....30
Zoom out Trace Vertically 30
Zoom in Trace Vertically.... 30
Zooming Shortcuts 30
Re-analyze a Trace 30
Save a Trace 30
Browse Saved Traces 31
Alter Measurements in Realtime Testing 31
Power Meter, Laser Source, and VFL Settings 32
Optical Power Meter Settings 32
Zeroing the Optical Power Meter 32
Stabilized Laser Source Settings 33
Visible Fault Locator Settings.... 33
Link Viewer....34
Display Mode 34
Events Summary.... 35
Pass/Fail Setup 35
Pass/Fail Settings 36
Macrobend Analysis.... 36
Section 5. Calibration and Maintenance 38
Calibration Requirements 38
Maintenance and Replacement of Batteries 38
Cleaning 39
Before Cleaning....39
Cleaning Interfaces and Connectors 39
Tools for Cleaning Interfaces and Connectors 39
Prcedure for Cleaning Interfaces and Connectors.... 39
Section 6. Specifications 40
Stabilized Laser Source Module 41
Optical Power Meter Module 41
Section 7. Calibration and Maintenance 42
Software Installation 42
Computer System Requirements.... 42
Installation 42
Software GUI 42
Graphical User Interface (GUI) 42
Menu, Tool Bar, and Status Bar 42
File (F) 43
Edit (E) 43
View (V) 43
OTDR (O) 44
Window (W) 45
Help (H) 45
Information Subwindows 46
Trace Display Window.... 46
Events List Window 46
Parameter Window 47
Fiber Section Information Window....47
Fiber Chain Information Window 47
Software Functions 48
Upload Trace Data 48
Option 1: 48
Option 2: 48
Browse Traces....49
Tool Bar 49
Open Trace File 50
Zoom in and out of Trace 50
Review Trace Information 50
Save Trace 52
ASCII Format Output 52
Edit Optical Fiber Information....52
Revise Events List.... 53
Add Event 53
Revise Event 53
Delete Event....53
Printing 54
Printing Options 54
Printing Setup 54
Printing Preview 55
Printing....56
Batch Edit 56
Batch Print....56
Batch Print Preview 57
Exit Software 58
Preface
Description
The Tempo Communications fiberTOOLS™ 930XC instruments are handheld Optical Time Domain Reflectometers (OTDRs) for measuring the specifications of single-mode or multi-mode optical fiber.
• The 930XC-20C measures optical fiber at 1310 nm and 1550 nm.
• The 930XC-20M measures optical fiber at 850 nm and 1300 nm.
• The 930XC-30F measures optical fiber at 1310 nm, 1550 nm, and 1625 nm.
- The 930XC-30P measures optical fiber at 1310 nm, 1490 nm, and 1550 nm. Included with the 930XC instruments are the following:
• USB and serial data transfer cables
- Power adapter
• Vehicle adapter power cord
• Trace Viewer software installation disk
• Instruction manual
- Soft carrying case
Safety
Safety is essential in the use and maintenance of Tempo Communications tools and equipment.
This instruction manual and any markings on the tool provide information for avoiding hazards and unsafe practices related to the use of this tool. Observe all of the safety information provided.
Purpose of This Manual
This instruction manual is intended to familiarize all personnel with the safe operation and maintenance procedures for the Tempo Communications 930XC handheld OTDRs.
Keep this manual available to all personnel. Replacement manuals are available upon request at no charge.
Warranty
Tempo Communications Inc. warrants to the original purchaser of these goods for use that these products will be free from defects in workmanship and material for one year. This warranty is subject to the same terms and conditions contained in Tempo Communication's standard one-year limited warranty.
For all Test Instrument repairs, contact Customer Service at 800-642-2155 to request a Return Authorization.
For items not covered under warranty (such as items dropped, abused, etc.), a repair cost quote is available upon request.
Note: Prior to returning any test instrument, please check replaceable batteries or make sure the battery is at full charge.
All specifications are nominal and may change as design improvements occur.
Important Safety Information

SAFETY
ALERT
SYMBOL
This symbol is used to call your attention to hazards or unsafe practices which could result in an injury or property damage. The signal word, defined below, indicates the severity of the hazard. The message after the signal word provides information for preventing or avoiding the hazard.
! DANGER
Immediate hazards which, if not avoided, WILL result in severe injury or death.
WARNING
Hazards which, if not avoided, COULD result in severe injury or death.
CAUTION
Hazards or unsafe practices which, if not avoided, MAY result in injury or property damage.

WARNING
Read and understand all of the instructions and safety information in this manual before operating or servicing this tool.
Failure to observe this warning could result in severe injury or death.
CE
WARNING
Electric shock hazard:
- Do not operate in an explosive atmosphere such as in the presence of flammable gases or fumes.
- Before applying power, verify that the unit is set to match the available line voltage.
Failure to observe these warnings could result in severe injury or death.
Important Safety Information (cont'd)
WARNING
Electric shock hazard:
- Fuse replacement should be performed by Tempo qualified personnel.
- Do not use repaired fuses or short-circuited fuse holders.
Failure to observe these warnings could result in severe injury or death.
CAUTION

LASER LIGHT DO NOT STARE INTO BEAM
CLASS 1 LASER PRODUCT
The 930XC instruments are laser devices conforming to the requirements of CDRH, CFR 1040, Subchapter J. While there is no potential for eye damage due to unaided direct exposure, users should always avoid looking directly into the output port. The use of optical viewing instruments, such as microscopes, magnifiers, etc., should always be avoided. The use of such devices around active fibers can focus an intense beam of light energy onto the retina of the eye, which can result in permanent damage.
CAUTION
Laser hazard:
- When performing measurements on fiber optic systems, avoid eye exposure to any open-ended fibers, optical connectors, optical interfaces, or other sources because they may be connected to active laser transmitters.
- Do not look into the optical port when a source is turned on.
- Avoid looking at the free end of a test fiber, i.e., the end not connected to the instrument. If possible, direct the free end toward a non-reflective surface.
Failure to observe these precautions may result in injury.
Important Safety Information (cont'd)
CAUTION
Electric shock hazard:
- Do not expose batteries to fire or intense heat. Do not open or mutilate batteries. Avoid touching the electrolyte in the batteries, which is corrosive and may cause damage to eyes or skin.
- Do not open the case of the unit for any reason. It contains no user-serviceable parts.
- Use this unit for the manufacturer's intended purpose only, as described in this manual. Any other use can impair the protection provided by the unit.
Failure to observe these precautions may result in injury and may damage the unit.
CAUTION
Instrument damage hazard:
- Make sure that the optical fiber or cable is not in use and there is no laser beam in the fiber before testing with this unit.
- Do not leave the unit in direct sunlight or near direct sources of heat.
- Protect the unit from strong impacts or shock.
- Do not immerse the unit in water or store in areas with high humidity.
- When necessary, clean the case, front panel, and rubber cover with a damp cloth. Do not use abrasives, harsh chemicals, or solvents.
- Replace the protective dust cap when the unit is not in use.
- Store the unit and interface adapters in a cool, dry, and clean place.
Failure to observe these precautions may result in injury and may damage the unit.
CAUTION
Electric shock hazard:
- Do not expose the unit to extremes in temperature or high humidity. Refer to "Specifications."
- Turn the unit off, disconnect from power, and make sure the laser source is off before cleaning.
Failure to observe these precautions may result in injury and may damage the unit.
Section 1. Introduction
Tempo's 930XC handheld OTDRs can make an assessment of one single optical fiber or a whole optical fiber chain. In addition, the user can directly observe loss and events distribution of an optical fiber chain.
The 930XC tools check the transmission quality of optical fiber through the measurement of backscatter. Standard organizations like the International Telecom Union (ITU) define backscatter as an effective analysis means to measure optical fiber loss. Backscattering is also the only effective way of connector inspection, which can be applied to measure the length of optical fiber.
The 930XC OTDRs operate by reviewing events in optical fiber (for example, irregularities and connectors). These tools can help identify irregularities in optical fiber, locate them, and measure their attenuation, relevant loss, and homogeneity. These tools are easy-to-use, small, and compact with large LCD displays and graphical interfaces. They can save and transfer the measurement curves data to a PC by using the provided Trace Viewer software for further analyzing, reporting, and printing.
Basic applications:
• Measure the length of optical fiber and cable.
• Measure the distance between two points on optical fiber and cable.
- Locate faults and ruptures of optical fiber and cable.
• Display distribution curve of optical fiber and cable loss.
• Measure attenuation coefficient of optical fiber and cable.
• Measure loss between two points on optical fiber and cable.
• Measure loss of tie-ins.
• Measure reflection of reflection events of optical fiber and cable.
• The 930XC-30F can measure live optical fibers at 1625 nm.
For a specific event (transmission quality changed due to faults caused by fusion splicing, connector, bending, etc.), the following measurements can be carried out:
• For each event: Distance, loss, and reflection.
- For each section of optical fiber: Length and loss of dB or dB/unit length.
• For the whole optical fiber chain: Length and loss of dB.
Additional features:
• Large LCD display with auto or manual adjustment of contrast.
- Backlight LCD display supports night operation.
- Easy operation with trace graphic display.
- Trace storage function.
• RS-232 and USB data upload ports.
- Trace Viewer software for analyzing and reporting previously stored data.
• Auto off function to conserve battery life.
- DC/AC power supply.
- Macrobend analysis.
- Link Viewer for automated Pass/Fail analysis.
Section 2. Basic Operation
This section describes the basic operation of the 930XC instruments. Specific operations are explained in detail in Section 3 of this manual.
Instrument Interface Description
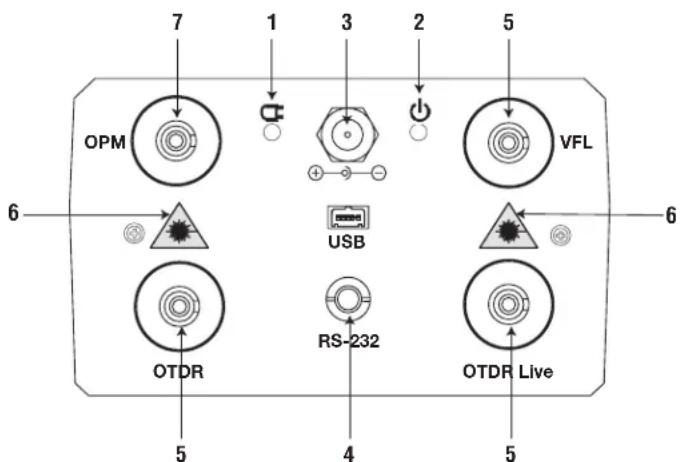
text_image
7 1 3 2 5 OPM VFL 6 USB OTDR RS-232 OTDR Live 5 4 5 6Figure 2-1. Interface Panel
-
Charge Indicator: When lit, measurement power is charging.
-
Power Indicator: When lit, measurement power is on.
-
AC Power Jack: Power adapter jack requirements are 13.8 VDC at 1.2 A.
-
Data Transfer Ports: USB and RS-232 interfaces to transfer saved traces in the instrument to a PC for further analysis with Trace Viewer software (provided).
-
Fiber Optic Output for OTDR or 1625 nm live fiber, and VFL (visual fault locator): Connector is used for the OTDR interface.
-
Invisible Laser Caution: Do not look directly at the optical output or stare at the laser beam.
7. OPM Optical Power Meter
Use of Batteries
The 930XC tools use a NiMH battery.
Auto Off Mode
- The instrument will enter auto off mode when there is insufficient power during operation. The low power icon will be displayed on the LCD.
- If unused for a long time, causing insufficient power, the instrument will enter auto off mode several seconds after powering on in order to protect the batteries in case of excessive discharging. The internal battery should be recharged immediately through the adapter.
Recharging
- Perform a quick charge first, and then switch to trickle charge after the voltage reaches a predefined figure. Quick charge temperature is 5 °C to 45 °C (41 °F to 113 °F), and trickle charge temperature is 0 °F to 55 °C (32 °F to 131 °F). Battery will not be fully charged or may be damaged if the charging temperature is beyond the above range, which may shorten battery life.
• A quick charge takes 3 hours.
Keypad Functions
flowchart
graph TD
    A["On/Off"] --> B["▲"]
    C["Shift/Q"] --> D["▼"]
    E["Enter"] --> F["▲"]
    G["Run/Stop"] --> H["▲"]
    I["Shift/Q"] --> J["▼"]
    K["Enter"] --> L["▲"]
    M["Shift/Q"] --> N["▼"]
    O["Enter"] --> P["▲"]
    Q["Shift/Q"] --> R["▼"]
    S["Enter"] --> T["▲"]
    U["Shift/Q"] --> V["▼"]
    W["Enter"] --> X["▲"]
    Y["Shift/Q"] --> Z["▼"]
    AA["On/Off"] --> AB["▲"]
    AC["Run/Stop"] --> AD["▲"]
    AE["Shift/Q"] --> AF["▼"]
    AG["Enter"] --> AH["▲"]
    AI["Shift/Q"] --> AJ["▼"]
    AK["Enter"] --> AL["▲"]
    AM["Shift/Q"] --> AN["▼"]
    AO["Enter"] --> AP["▲"]
    AQ["Shift/Q"] --> AR["▼"]
    AS["Enter"] --> AT["▲"]
    AU["Shift/Q"] --> AV["▼"]
    AW["Enter"] --> AX["▲"]
    AY["On/Off"] --> AZ["▲"]
    BA["Run/Stop"] --> BB["▲"]
    BC["Shift/Q"] --> BD["▼"]
    BE["Enter"] --> BF["▲"]
    BG["Shift/Q"] --> BH["▼"]
    BI["Enter"] --> BJ["▲"]
    BK["Shift/Q"] --> BL["▼"]
    BM["Enter"] --> BN["▲"]
    BO["Shift/Q"] --> BP["▼"]
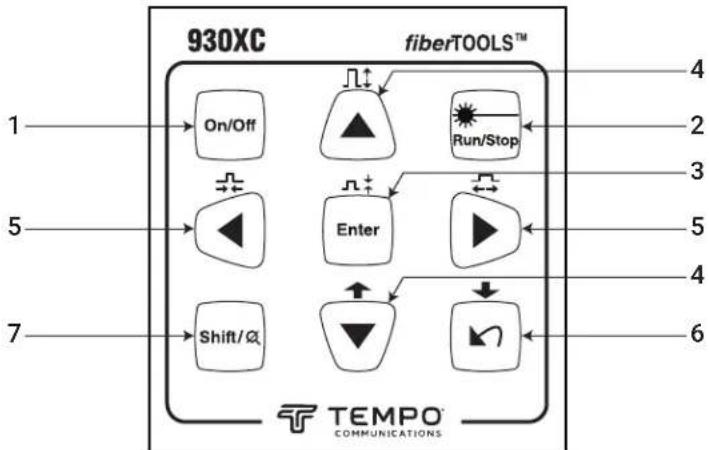
Figure 2-2. 930XC Keypad
-
On/Off: Press to turn power on or off to the instrument.
-
Run/Stop:
• Under GUI, press to start measurement.
• While testing, press to stop measurement.
- Enter:
• Under GUI, press to confirm the current operation.
• Use with the Shift key to zoom out trace vertically.
-
▲▼ (up and down) arrows:
-
Move menu bar in menu operation.
• Highlight the icon to be selected. - Adjust parameter in parameter configuration.
• Use q with the Shift key to browse up the events list. -
Use p with the Shift key to zoom in trace vertically.
-
◀▶ (left and right) arrows:
-
Select parameter to be adjusted in parameter configuration.
- Move marker left or right in trace operation.
• Turn page while in Help submenu. -
Use with the Shift key to zoom out or zoom in trace horizontally.
-
arrow:
-
Read Help menu when power on.
- Cancel the current operation.
- Exit menu configuration.
-
Switch between information windows.
• Use with the Shift key to browse down the events list. -
Shift:
• Under GUI, press to return a trace to original size without any zoom.
- Activate the integration function by pressing this key together with other keys.
Section 3. Basic OTDR Information
Principle of OTDRs
An OTDR (Optical Time Domain Reflectometer) is a measurement instrument for identifying optical fiber transmission features. The OTDR is used to measure the overall attenuation of a fiber optic link and to provide details relating to the position of each event in that link. Events include splices, connectors, bends, and optical components. Its non-destructive, single-ended connection and rapid measurement have made the OTDR an indispensable tool for manufacturing, construction, and maintenance of optical fiber links.
The faults and heterogeneity of optical fiber itself cause Rayleigh scattering of light transmitted in optical fiber. Part of the light pulse is scattered in the reverse direction, and this is called Rayleigh backscattering, which actually provides attenuation details relating to fiber length.
Information relating to distance is obtained through time information (thus "time domain" in the name OTDR). Fresnel reflection occurs at the boundary between two media of different IOR (for example, connections of faults, connectors, or optical fiber end). This reflection is used to locate the discontinuous points on optical fiber. The magnitude of reflection depends on the difference between IOR and the smoothness of boundary.
An OTDR sends out a light pulse into the optical fiber and receives reflections of events and backscattering power of the pulse in time. Locations will be displayed on the LCD. The y-axis is the dB value of backscattering power, and the x-axis is the distance.
Basic Definition and Classification of Events
Events refer to any abnormal points causing attenuation or sudden change of scattering power besides the normal scattering of optical fiber, which include losses such as bending, connections, and ruptures.
Event points displayed on the LCD are abnormal points that cause traces to deviate from a straight line.
Events can be classified as reflection events or non-reflection events.
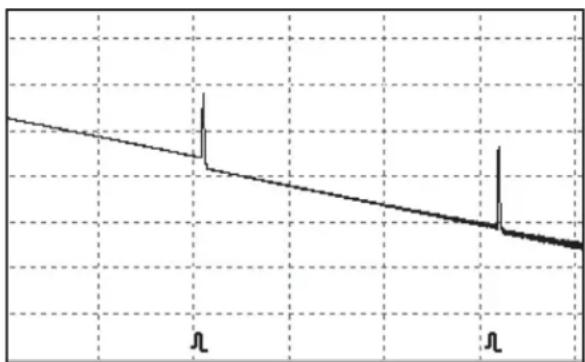
Reflection Events
When some pulse energy is scattered, reflection events occur. When reflection events occur, a peak is displayed on the trace
line
| x | y | | ---- | ----- | | 0.0 | 1.0 | | 0.5 | 0.8 | | 1.0 | 0.6 | | 1.5 | 0.4 | | 2.0 | 0.2 | | 2.5 | 0.1 | | 3.0 | 0.05 | | 3.5 | 0.02 | | 4.0 | 0.01 |Figure 3-1. Reflection Event
(Figure 3-1).
Non-reflection Events

line
| X | Y | |----|----| | 0 | 100 | | 1 | 95 | | 2 | 90 | | 3 | 85 | | 4 | 80 | | 5 | 75 | | 6 | 70 | | 7 | 65 | | 8 | 60 | | 9 | 55 | | 10 | 50 |Figure 3-2. Non reflection Event
When some pulse energy is scattered, reflection events occur. When reflection events occur, a peak is displayed on the trace (Figure 3-1).
Measurement Application
The 930XC instruments display power relating to the distance of returning signals. This information can be used to identify the main properties of an optical fiber chain.
Measurement Contents
• Event location (distance), end, or rupture of optical fiber chain.
• Attenuation coefficient of fiber.
- Loss of a single event (for example, one optic tie-in), or total loss from upper end to end.
- Range of a single event like reflection of connectors (or grade of reflection).
• Auto measurement of cumulative loss of a single event.
Trace Analysis
The trace analysis of the 930XC OTDR is fully automatic. The trace locates:
• Reflection events of connections and mechanical tie-ins.
• Non-reflection events.
• End of optical fiber.
• Through scanning the first loss event that is larger than the end threshold, identifies the end of optical fiber.
• Events list: Event type, loss, reflection, and distance.

line
| Parameter | Value | | --------- | --------- | | Refl. | -38.12dB | | Ins.l. | 0.85dB | | Attn. | 0.22dB/km |Figure 3-3. Trace Display Screen
Trace Display Screen
The trace displays on the 930XC screen (Figure 3-3).
Trace Display Window
This window displays the trace after one measurement.
Definition of trace: After one measurement, the reflection power diagram will be displayed as a distance function. This diagram is referred to as trace.
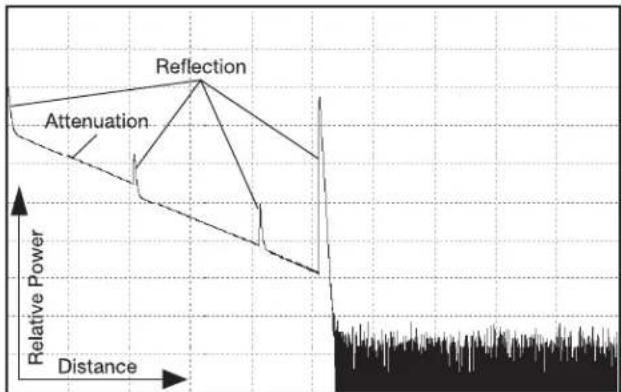
text_image
Reflection Attenuation Relative Power DistanceFigure 3-4. Traces and Coordinates
The trace of the 930XC displays measurement results in a graphic form. The y-axis represents the power while the x-axis represents the distance (Figure 3-4).
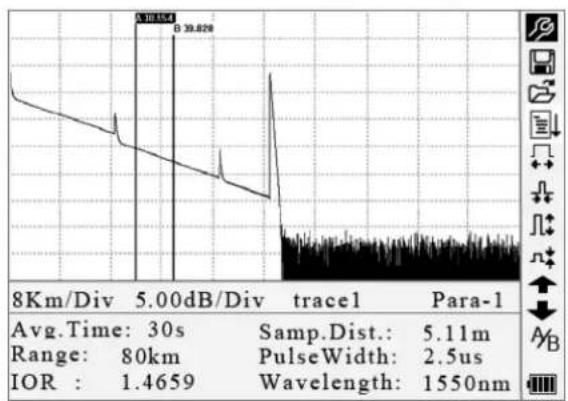
Information Window
The contents of this window are measurement parameters, events list, marker A/B, and analysis parameters.
line
| Metric | Value | | ---------------- | ------- | | Avg.Time | 30s | | Range | 80km | | PulseWidth | 2.5us | | IOR | 1.4659 | | Wavelength | 1550nm |
line
| Date | NRefl.Thre. | End Thre. | Refl.Thre. | Scat.Coef. | | ---------- | ----------- | --------- | ---------- | ---------- | | 27-May-2019 | 0.20 | 3.00 | -52.00 | -51.50 |Figure 3-5b. Analysis Trace Parameters Figure 3-5a. Measurement Trace Parameters
Measurement Trace Parameters
Important measurement and analysis parameters are displayed in the information window (Figures 3-5a and 3-5b). For definitions and configurations of items in Figure 3-5a (average time, sample distance, range, IOR, wavelength, and pulse width) as well as definitions of items in Figure 3-5b (date, reflection threshold, non-reflection threshold, end threshold, and scattering coefficient), refer to "Parameter Configuration" in this section of the manual.
Events List

line
| Metric | Value | |--------|-----------| | No. | 2/4 | | Refl. | -38.12dB | | Ins.L | 0.85dB | | Attn. | 0.22dB/km | | Cum.L | 5.57dB |Figure 3-6. Events List
The events list indicates the location of events inspected. Any defined posts will be displayed in the events list (for example, a non-reflection event such as a fusion splice or a reflection event such as a connector) (Figure 3-6).
• No.: Event sequence number.
• Four types of events: begin end; reflection event; fiber end; attentuation event.
• Location: Distance from beginning point to event.
• Refl.: Magnitude of reflection.
• Ins.L.: Loss of inserted event.
- Attn.: Attenuation characteristic from one event point to the current event.
• Cum.L.: Cumulative loss, calculating from beginning point to the current event.
line
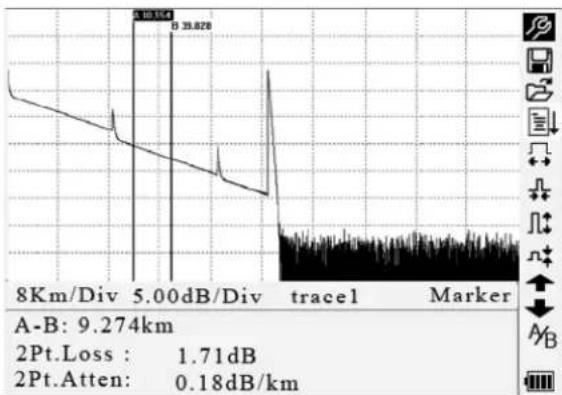
| Metric | Value | | -------------- | --------- | | A-B | 9.274km | | 2Pt.Loss | 1.71dB | | 2Pt.Atten | 0.18dB/km |Figure 3-7. Marker A/B Information
Marker A/B Information
A marker is used to mark and analyze a single event, trace section, and distance. Distance, attenuation, and loss at a marker or between markers will be displayed in marker information (Figure 3-7).
The following parameters are measured between marker A and B. Changing either marker will change the record accordingly.
• A-B: Distance between two markers.
- 2Pt. Loss: Loss between two markers; power difference between two markers.
• 2Pt. Atten: 2 points loss of unit length.
The specific operations of the above items are explained in more detail later in this manual.
line
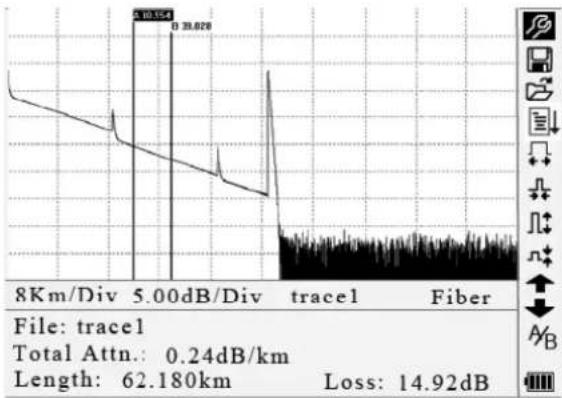
| Metric | Value | | -------------- | --------- | | Time (dB) | 5.00 | | Label | 33.028 | | Total Attn. | 0.24 | | Length | 62.180 | | Loss | 14.92 |Figure 3-8. Fiber Information
Fiber Information
Fiber information includes total attenuation, length, and loss of the tested fiber (Figure 3-8).
| No. Icons Description | ||
| 1 | Parameter configuration | |
| 2 | Save file | |
| 3 | Open file | |
| 4 | Re-analyze the trace | |
| 5 | Zoom out trace horizontally | |
| 6 | Zoom in trace horizontally | |
| 7 | Zoom out trace vertically | |
| 8 Zoom in trace vertically | ||
| 9 | A/B | Switch between markers |
| 10 | Review events list upward | |
| 11 Review events list downward | ||
| 12 Battery power indicator | ||
Menu Bar and Icons
Notes:
• Under the Help menu, only numbers 1 and 3 are operational.
• In the process of measurement, all functions on the menu bar will be disabled.
- Numbers 3, 4, 5, 6, 7, 8, and 9 are tools for trace analysis. Numbers 10 and 11 are tools for reviewing events list.
- Number 1 is explained in the next section, "Parameter Configuration."
Parameter Configuration
Correct parameter configuration is necessary for accurate measurements.
Use ▲ and ▼ to highlight ⚙ (i.e., parameter configuration on the menu bar), and then press Enter (Figure 3-9).
Press ▶to exit.

text_image
Range PulseWidth Avg. Time Wavelength Meas. Mode PM/LS Length Units IOR Scat. Coef. Nrefl.Thre. Refl.Thre. End Thre. Meter [m] 1.4666 -52.1dB 0.20dB -52.00dB 3.00dB 2005-05-27 10:30:20 Auto Off Language LCD Contrast Color Mode Load Default Color 2 Help IOK : 1.4000 wavelengan : 1330 nm Scat.Coef. -82.0dB NRefl.Thre. 0.20dB Refl.Thre. -52.00dB End Thre. 2005-05-27 10:30:20 Language English LCD Contrast Color Mode Color 2 Load Default HelpFigure 3-9. Parameter Configuration
Definitions of Measurement Parameters
| Range | Length of optical fiber relevant to the trace |
| Pulse Width | Width of laser pulse sent out from OTDR to optical fiber |
| Average Time Select suitable testing time | |
| Wavelength Select laser wavelength for measurement | |
| Measurement Mode Select mode for measurement | |
| PM/LS | Optical power meter, stabilized laser source, and VFL |
| Length Units | Select units of measurement |
| IOR | IOR of optical fiber which affects the transmission speed of laser |
| Scatter Coefficient | Affects backscatter power of laser in fiber |
| Non-reflection Threshold | Events whose insertion loss is ≥ the threshold displayed here |
| Reflection Threshold | Reflection events ≥ the threshold displayed here |
| End Threshold First event | with insertion loss ≥ the threshold is considered the end of fiber, and all following events will be ignored |
| Delete File Delete stored trace data in the instrument | |
| Time Show current system time | |
| Auto Off Enable or disable auto off function | |
| Lang./语言 | Choose language |
| LCD Contrast Adjust contrast of LCD | |
| Color Mode Select suitable color setting for display | |
| Load Default Set all parameters to factory setting | |
| Help | Show Help files (quick reference) |
Range Configuration
Generally, the range is set according to the actual length of optical fiber in order to insure the accuracy of the measurement. Under the parameter configuration menu use ▲ and ▼ to highlight "Range." Press Enter to select a range (Figure 3-10).
Press to exit.

text_image
Range PulseWidth Avg.Time Wavelength Meas.Mode PM/LS Length Units IOR Scat. Coef. Nrefl.Thre. Refl.Thre. End Thre. Auto 300 m 1.3 km 2.5 km 5 km 10 km 20 km 40 km 80 km 160 km 240 km IOK : 1.4000 wavelength : 1330 nmFigure 3-9. Range Configuration
Use ▲ and ▼ to select an adequate range. Press Enter to confirm.
Notes:
- "Auto" means automatic measurement. When this function is selected, the instrument automatically selects an adequate range and pulse width for the measurement. The process of measurement does not require any intervention by the user.
- "Auto" is the default setting.
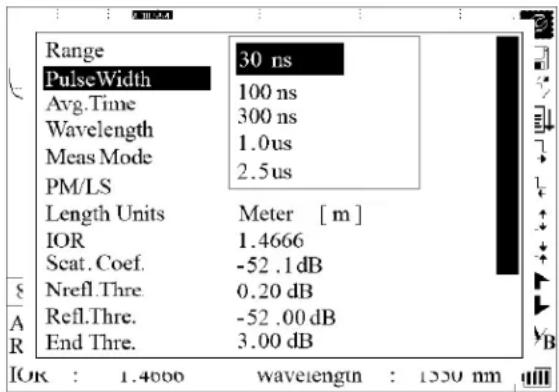
Pulse Width Configuration
The selection of pulse width affects the dynamic range and resolution of the measurement. With a narrow pulse width there will be higher resolution and smaller deadzone; however, the dynamic range will be decreased. A wide pulse width will bring higher dynamic range and measure comparatively longer distance, but resolution and deadzone will be increased. Therefore, users should make the choice between dynamic range and deadzone.
The options for pulse width will change according to the distance range selected.
Under the parameter configuration menu use ▲ and ▼ to highlight "PulseWidth." Press Enter to select a value (Figure 3-11).
Press to exit.
text_image
Range 30 ns PulseWidth 100 ns Avg.Time 300 ns Wavelength 1.0 us Meas Mode 2.5 us PM/LS Length Units Meter [m] IOR 1.4666 Scat. Coef. -52.1 dB Nrefl.Thre. 0.20 dB Refl.Thre. -52.00 dB End Thre. 3.00 dB IOR : 1.4000 wavelength : 1330 nmFigure 3-11. Pulse Width Configuration
Use ▲ and ▼ to highlight the pulse width. Press Enter to confirm.
Notes:
- "Auto" is the default setting.
- When the range is set to "Auto," the pulse width automatically is set to "Auto."
Average Time Configuration
Average time will affect the SNR directly. The longer the average time is, the higher SNR is, as well as dynamic range. Therefore, when measuring long-distance optical fiber, a long average time should be selected in order to review events at the long-distance end.
Under the parameter configuration menu use ▲ and ▼ to highlight "Avg. Time." Press Enter to confirm (Figure 3-12).
Press no exit.
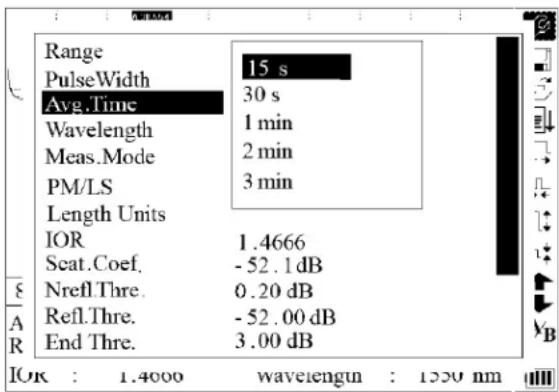
text_image
Range 15 s PulseWidth Avg.Time 30 s Wavelength 1 min Meas.Mode 2 min PM/LS 3 min Length Units IOR 1.4666 Scat.Coef. -52.1 dB Nrefl.Thre. 0.20 dB Refl.Thre. -52.00 dB End Thre. 3.00 dB IOK : 1.4000 wavelength : 1520 nmFigure 3-12. Average Time Configuration
Use ▲ and ▼ to highlight the pulse width. Press Enter to confirm.
Notes:
• There are five levels of predefined average time: 15 s, 30 s, 1 min, 2 min, and 3 min.
• The default setting is "30 s."
Wavelength Configuration
Under the parameter configuration menu use ▲ and ▼ to highlight "Wavelength." Press Enter to change the wavelength (Figure 3-13).
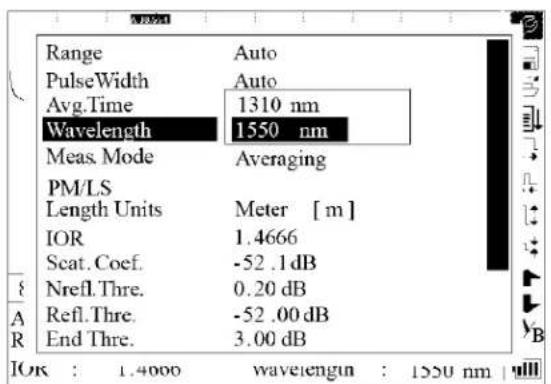
text_image
Range PulseWidth Avg.Time Wavelength Meas. Mode PM/LS Length Units IOR Scat. Coef. Nrefl. Thre. Refl. Thre. End Thre. Auto Auto 1310 nm 1550 nm Averaging Meter [m] 1.4666 -52.1 dB 0.20 dB -52.00 dB 3.00 dB OK : 1.4000 wavelength : 1550 nm |Figure 3-13. Wavelength Configuration
Measurement Mode Configuration
There are two kinds of measurement mode: averaging and realtime. Under realtime mode the 930XC will undertake realtime measurement for the connector of exterior fiber and refurbish the measured trace. While under realtime mode, press Run/Stop to stop; otherwise it will measure continuously. Under Averaging mode the tool will average the data within the measure time, which is set by the user. When exceeding the set time, it will stop automatically and display the result. In general, averaging is the preferred mode.
Under the parameter configuration menu use ▲ and ▼ to highlight "Meas. Mode." Press Enter to select "Averaging" or "Realtime" mode (Figure 3-14). Press ▶ exit.

text_image
Range Auto PulseWidth Auto Avg.Time 30 s Wavelength 1550 nm Meas. Mode Averaging PM/LS Length Units Meter [m] IOR 1.4666 Seat.Coef. -52.1 dB Nrefl.Thre. 0.20 dB Refl.Thre. -52.00 dB End Thre. 3.00 dB IOK : 1.4000 wavelength : 1550 nmFigure 3-14. Measurement Mode Configuration
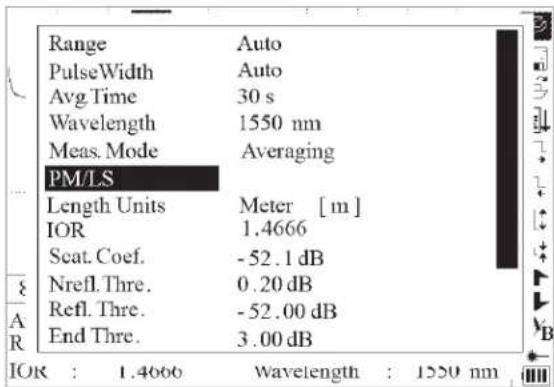
Power Meter, Laser Source, and VFL Configuration
Under the parameter configuration use ▲ and ▼ to highlight "PM/LS" and press Enter to enter PM/LS interface (Figure 3-15). Refer to "Power Meter, Laser Source, and VFL Settings" in Section 4 for details.
text_image
Range Auto PulseWidth Auto Avg.Time 30 s Wavelength 1550 nm Meas. Mode Averaging PM/LS Length Units Meter [m] IOR 1.4666 Scat. Coef. -52.1 dB Nrefl. Thre. 0.20 dB Refl. Thre. -52.00 dB End Thre. 3.00 dB IOR : 1.4666 Wavelength : 1550 nm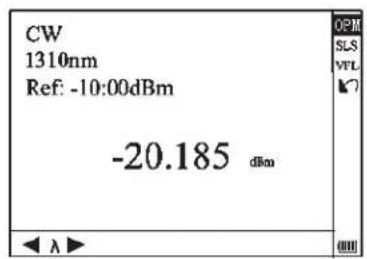
text_image
CW 1310nm Ref: -10:00dBm -20.185 dBmFigure 3-15. Power Meter and Laser Source Configuration
Length Units
Under the parameter configuration menu use ▲ and ▼ to highlight "Length Units." Press Enter to select the desired units of measurement (Figure 3-16). Press ▶to exit.
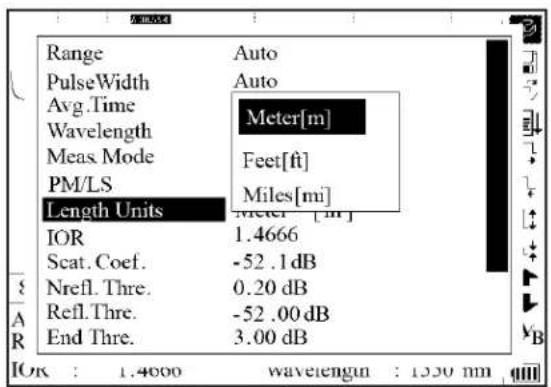
text_image
Range PulseWidth Avg.Time Wavelength Meas. Mode PM/LS Length Units IOR Scat. Coef. Nrefl. Thre. Refl. Thre. End Thre. Auto Auto Meter[m] Feet[ft] Miles[mi] Meter [m] 1.4666 -52.1 dB 0.20 dB -52.00 dB 3.00 dBFigure 3-16. Length Units
Index of Refraction (IOR) Configuration
Because IOR is a key factor affecting the speed of laser transmission in optical fiber, the IOR configuration has a direct impact on the accuracy of measurement. In general, the IOR parameter is provided by the optical fiber manufacturer, and it can be set to the accuracy of four digits after the decimal point between 1.0 and 2.0.
Under the parameter configuration menu use ▲ and ▼ to highlight "IOR." Press Enter to enter a value (Figure 3-17).
Press to exit.
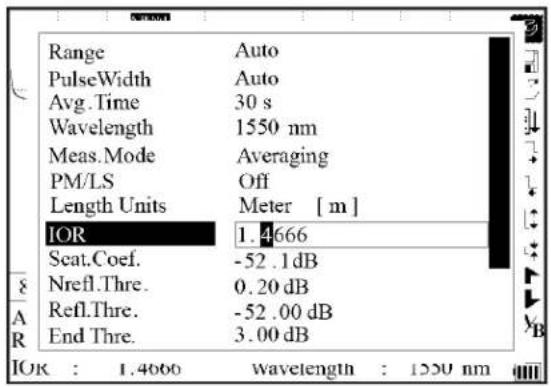
text_image
Range Auto PulseWidth Auto Avg.Time 30 s Wavelength 1550 nm Meas.Mode Averaging PM/LS Off Length Units Meter [ m ] IOR 1.4666 Seat.Coef. -52.1 dB Nrefl.Thre. 0.20 dB Refl.Thre. -52.00 dB End Thre. 3.00 dB IOK : 1.4060 wavelength : 1250 nmFigure 3-17. IOR Configuration
Use ◀ and ▶ to adjust the position of the highlighted area. Use ▲ and ▼ to change the digits. After setting, press Enter to confirm.
Scatter Coefficient Configuration
Scatter coefficient determines the value of backscatter power. This configuration affects the calculation of reflection value. Under the parameter configuration menu use ▲ and ▼ to highlight "Scat. Coef." Press Enter to enter a value (Figure 3-18).
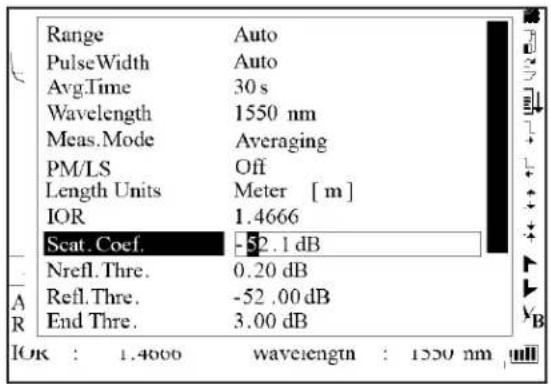
text_image
Range Auto PulseWidth Auto Avg.Time 30 s Wavelength 1550 nm Meas.Mode Averaging PM/LS Off Length Units Meter [ m ] IOR 1.4666 Scat. Coef. -52.1 dB Nrefl.Thre. 0.20 dB Refl.Thre. -52.00 dB End Thre. 3.00 dB IOK : 1.4000 wavelength : 1550 nmFigure 3-17. IOR Configuration
Press ▶to exit.
Use ◀ and ▶ to adjust the position of the highlighted area. Use ▲ and ▼ to change the digits. After setting, press Enter to confirm.
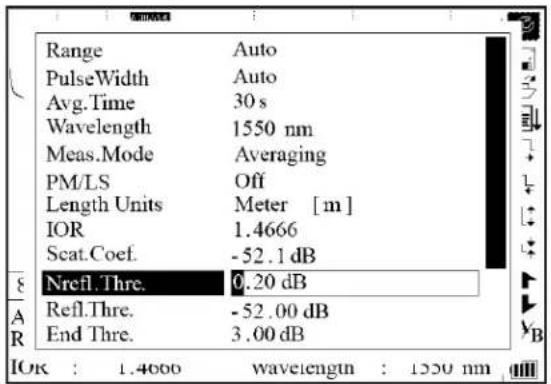
Non-reflection Threshold Configuration
This configuration has direct impact on the listing of insertion loss events. Only events ≥ to this threshold will be listed. Under the parameter configuration menu use ▲ and ▼ to highlight "Nrefl. Thre." Press Enter to enter a value (Figure 3-19). Press to exit.
text_image
Range Auto PulseWidth Auto Avg.Time 30 s Wavelength 1550 nm Meas.Mode Averaging PM/LS Off Length Units Meter [m] IOR 1.4666 Scat.Coef. -52.1 dB Nrefl.Thre. 0.20 dB Refl.Thre. -52.00 dB End Thre. 3.00 dB OK : 1.4000 wavelength : 1550 nmFigure 3-19. Non-reflection Threshold Configuration
Use ◀ and ▶ to adjust the position of the highlighted area. Use ▲ and ▼ to change the digits. After setting, press Enter to confirm.
Note: The default setting is "0.20 dB."
Reflection Threshold Configuration
This configuration has direct impact on reflection events listing. Only reflection events ≥ to this threshold will be displayed in the events list.
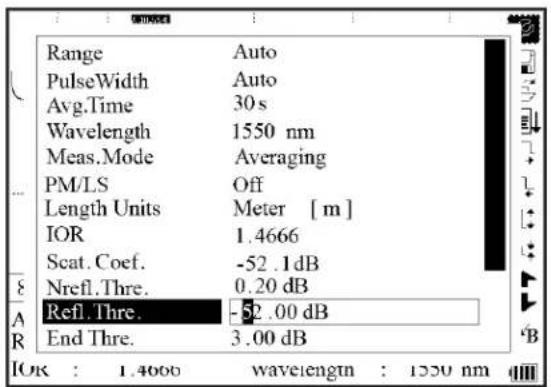
text_image
Range Auto PulseWidth Auto Avg.Time 30 s Wavelength 1550 nm Meas.Mode Averaging PM/LS Off Length Units Meter [m] IOR 1.4666 Scat. Coef. -52.1 dB Nrefl.Thre. 0.20 dB Refl.Thre. -52.00 dB End Thre. 3.00 dB IOK : 1.4000 wavelength : 1550 nmFigure 3-20. Reflection Threshold Configuration
Under the parameter configuration menu use ▲ and ▼ to highlight "Refl. Thre." Press Enter to enter a value (Figure 3-20). Press ▶to exit.
Use ◀ and ▶ to adjust the position of the highlighted area. Use ▲ and ▼ to change the digits. After setting, press Enter to confirm.
Note: The default setting is “-52.00 dB.”
End Threshold Configuration
This threshold is the end threshold of optical fiber. If the end threshold equals 3.0 dB, then the first event with insertion loss ≥ 3 dB will be considered the end of the optical fiber. If the value is set to 0 dB, there will be no end threshold.
Under the parameter configuration menu use ▲ and ▼ to highlight "End Thre." Press Enter to enter a value (Figure 3-21).
Press ▶to exit.
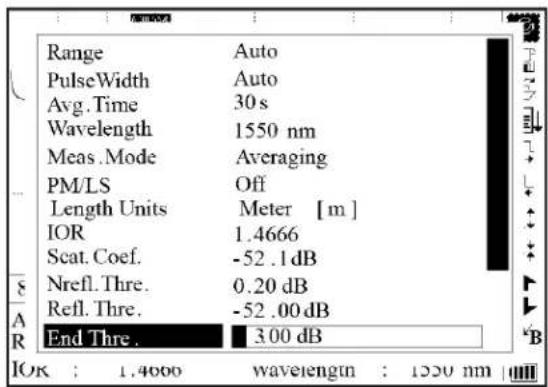
text_image
Range Auto PulseWidth Auto Avg.Time 30 s Wavelength 1550 nm Meas.Mode Averaging PM/LS Off Length Units Meter [m] IOR 1.4666 Scat. Coef. -52.1 dB Nrefl.Thre. 0.20 dB Refl.Thre. -52.00 dB End Thre. 3.00 dB IOK : 1.4000 wavelength : 1550 nmFigure 3-21. End Threshold Configuration
Use ◀ and ▶ to adjust the position of the highlighted area. Use ▲ and ▼ to change the digits. After setting, press Enter to confirm.
Note: The default setting is "03.00 dB."
Delete File
This function deletes saved traces.
Under the parameter configuration menu use ▲ and ▼ to highlight "Delete File." Press Enter to enter (Figure 3-22).
Press ▶to exit.
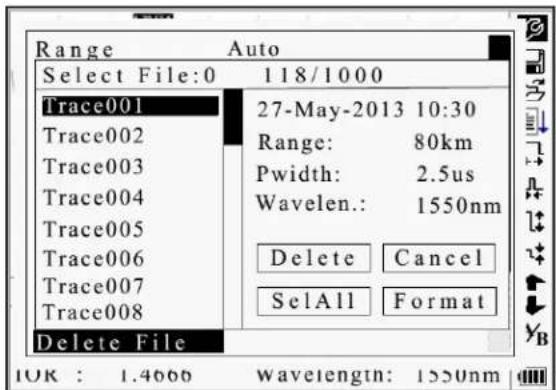
text_image
Range Auto Select File:0 118/1000 Trace001 27-May-2013 10:30 Trace002 Range: 80km Trace003 Pwidth: 2.5us Trace004 Wavelen.: 1550nm Trace005 Trace006 Delete Cancel Trace007 SelAll Format Trace008 Delete File IOK : 1.4666 wavelength: 1550nmFigure 3-22. Delete File
Use ▲ and ▼ to choose the files to delete, and press Enter to confirm. Or use the arrow keys to choose "SelAll," and press Enter to select all files.
One or several files can be deleted at a time. Use the arrow keys to select "Delete." Press Enter, and choose "Yes" to delete or "No" to not delete. Choosing "Cancel" will exit the Delete menu.
Format Memory
Press format memory to format the internal memory.
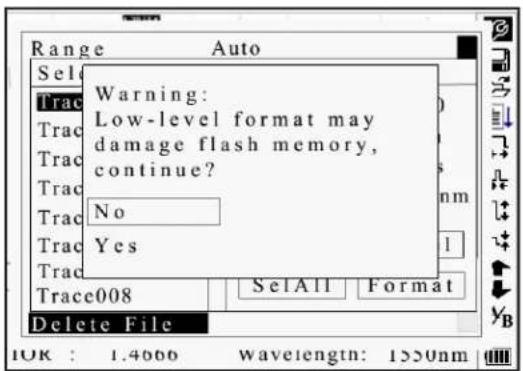
text_image
Range Auto Select Trac Warning: Low-level format may damage flash memory, continue? Trac No Trac Yes Trac Trace008 SelAll Format Delete File IOK : 1.4666 wavelength: 1550nmFigure 3-22a. Format Memory
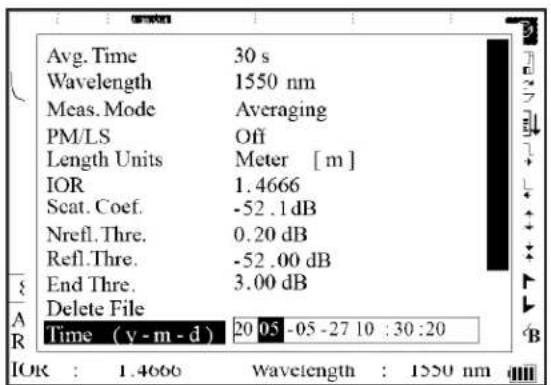
Time Configuration
Time configuration is used to change system time.
Under the parameter configuration menu use ▲ and ▼ to highlight "Time (y-m-d)." Press Enter to change (Figure 3-23).
text_image
Avg. Time 30 s Wavelength 1550 nm Meas. Mode Averaging PM/LS Off Length Units Meter [m] IOR 1.4666 Scat. Coef. -52.1 dB Nrefl. Thre. 0.20 dB Refl. Thre. -52.00 dB End Thre. 3.00 dB Delete File Time (y - m - d) 20 05 -05 -27 10 :30 :20 A R IOR : 1.4666 Wavelength : 1550 nmFigure 3-23. Time Configuration
Press to exit.
Use ◀ and ▶ to adjust the position of the highlighted area. Use ▲ and ▼ to change the digits. After setting, press Enter to confirm.
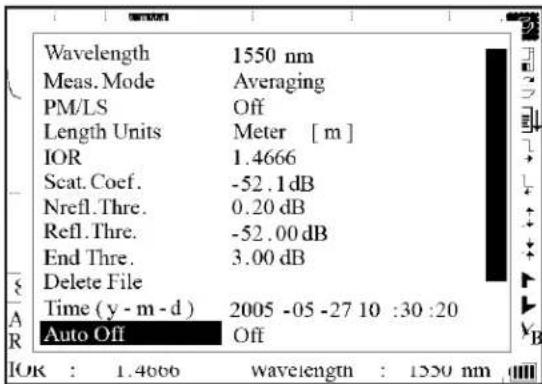
Auto Off Configuration
This function conserves battery power. When auto off is enabled, the instrument will automatically power off when idle for 5 minutes.
text_image
Wavelength 1550 nm Meas. Mode Averaging PM/LS Off Length Units Meter [m] IOR 1.4666 Scat. Coef. -52.1 dB Nrefl. Thre. 0.20 dB Refl. Thre. -52.00 dB End Thre. 3.00 dB Delete File Time (y - m - d) 2005 -05 -27 10 :30 :20 Auto Off Off OK : 1.4666 wavelength : 1250 nmFigure 3-23. Time Configuration
Under the parameter configuration menu use ▲ and ▼ to highlight "Auto Off." Press Enter to switch between "Off" and "On" (Figure 3-24). Press ▶to exit.
Note: The default setting is "On."
Language Configuration

text_image
Meas. Mode PM/LS Length Units IOR Scat. Coef. Nrefl. Thre. Refl. Thre. End Thre. Delete File Time(y - m - d) Auto Off Lang . / 语言 Averaging Off Meter [m] 1.4666 -52.1 dB 0.20 dB -52.00 dB 3.00 dB 2005 -05 -27 10 :30 :20 Off English IOR : 1.4666 Wavelength : 1550 nmFigure 3-25. Language Configuration
There are two language options: English and Chinese.
Under the parameter configuration menu use ▲ and ▼ to highlight "Lang./语言." Press Enter to switch the language (Figure 3-25). Press ▶to exit.
Contrast Adjustment of LCD
The contrast of the LCD can be adjusted.

text_image
PM/LS Off Length Units Meter [m] IOR 1.4666 Scat. Coef. -52.1dB Nrefl. Thre. 0.20 dB Refl. Thre. -52.00 dB End Thre. 3.00 dB Delete File Time (y -m -d) 2005 -05 -27 10 :30 :20 Auto Off Low High Lang./语言 LCD Contrast IOR : 1.4666 Wavelength : 1550 nmFigure 3-26. Contrast Adjustment of LCD
Under the parameter configuration menu use ▲ and ▼ to highlight "LCD Contrast," Press Enter to adjust (Figure 3-26). Press ▲ to exit.
Use ◀ and ▶ to adjust the contrast. After adjusting, press Enter to confirm.
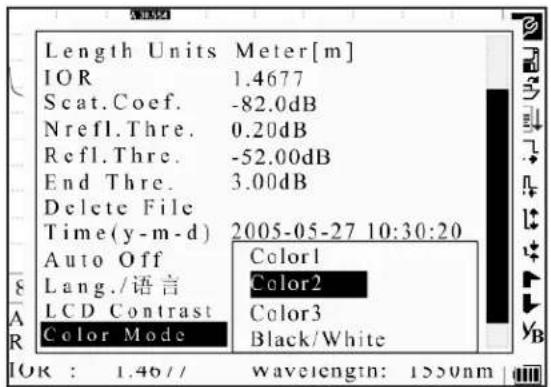
Color Mode Setting
This setting changes the color scheme of the display.
text_image
Length Units Meter[m] IOR 1.4677 Scat.Coef. -82.0dB Nrefl.Thre. 0.20dB Refl.Thre. -52.00dB End Thre. 3.00dB Delete File Time(y-m-d) 2005-05-27 10:30:20 Auto Off Color1 Lang./语言 Color2 LCD Contrast Color3 Color Mode Black/White IOR : 1.46// wavelength: 1550nmFigure 3-27. Color Mode Setting
Under the parameter configuration menu use ▲ and ▼ to highlight "Color Mode." Press Enter to choose a different mode (Figure 3-27). Press ▶to exit.
Use ▲ and ▼ to highlight the desired color mode setting. Press Enter to confirm the selection.
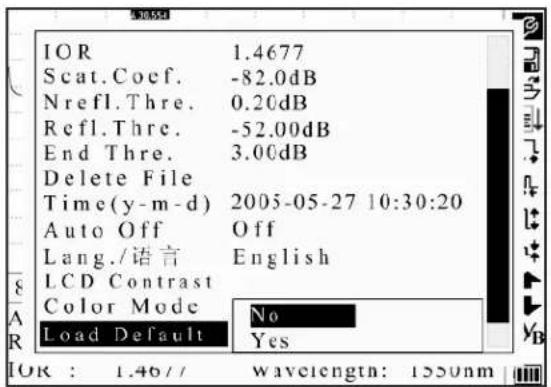
Default Setting
This function is used to set the OTDR parameters to factory settings. These parameters include: range, pulse width, average time, IOR, non-reflection threshold, reflection threshold, end threshold, and scatter coefficient.
text_image
IOR 1.4677 Scat.Coef. -82.0dB Nrefl.Thre. 0.20dB Refl.Thre. -52.00dB End Thre. 3.00dB Delete File Time(y-m-d) 2005-05-27 10:30:20 Auto Off Off Lang./语言 English LCD Contrast Color Mode No Load Default Yes IOR : 1.46// wavelength: 1550nmFigure 3-28. Default Setting
Under the parameter configuration menu use ▲ and ▼ to highlight "Load Default." Press Enter to choose a different mode (Figure 3-28). Press ▲ to exit.
Use ▲ and ▼ to highlight "Yes" or "No." Press Enter to confirm.
Help
The Help function provides access to the quick reference screen.
Under the parameter configuration menu use ▲ and ▼ to highlight "Help." Press Enter to display the quick reference screen (Figure 3-29). Press ▲to exit.
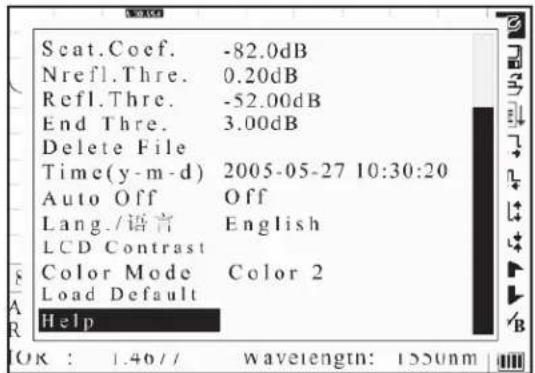
text_image
Scat.Coef. -82.0dB Nrefl.Thre. 0.20dB Refl.Thre. -52.00dB End Thre. 3.00dB Delete File Time(y-m-d) 2005-05-27 10:30:20 Auto Off Off Lang./语言 English LCD Contrast Color Mode Color 2 Load Default Help OK : 1.46// wavelength: 1550nmQuick reference
- Connect the fiber and OTDR.
- Press ▲ or ▼ to select icon. Press 'Enter' to activate function.
- Select to set parameters: IOR, Scat. Coef., pulsewidth, range, avg. Time, Refl. Thre., NonRefl. Thre and End Thre etc.
- Press 'Run/Stop' to start...
- Press to view measure results.
(◀ Page Up ▶ Page Down ◄ Quit)

text_image
Quick reference 6. Press◀or▶to move active marker. 7. Select □or▼ to zoom trace horizontally, and select □or▼ to zoom trace vertically. 8. Select▼B to switch markers. 9. Select▲or▼to browse event. 10. Select▼ to save files. 11. Select▼ to open saved files. Warning: Always Avoid Naked Eyes Exposed to Laser! (◀Page Up ▶Page Down ◀Quit)Figure 3-29. Help
Battery Recharge Status
When the 930XC is powered off and powered through the AC/DC adapter, the "CHARGE" indicator on the interface panel (Figure 2-1) will be lit. When the battery is fully recharged, the indicator will turn off. When the instrument is powered on and powered through the AC/DC adapter, the internal battery is automatically recharged. The icons mean the following:

Battery is being recharged

Battery is fully charged
When the 930XC is powered off and powered through the AC/DC adapter, the "CHARGE" indicator on the interface panel (Figure 2-1) will be lit. When the battery is fully recharged, the indicator will turn off.

No power

Low power

Half power

More than half power

Full power
Section 4. Trace Measurement and Processing of Existing Traces
Graphical User Interface (GUI) Instructions
When the 930XC is first turned on, an introductory screen appears on the LCD (Figure 4-1).

text_image
TEMPO® COMMUNICATIONS 930XC-XXX --- Version X.X ---Figure 4-1. Power On Screen
Three seconds after the instrument is turned on, a quick reference screen appears (Figure 4-2).
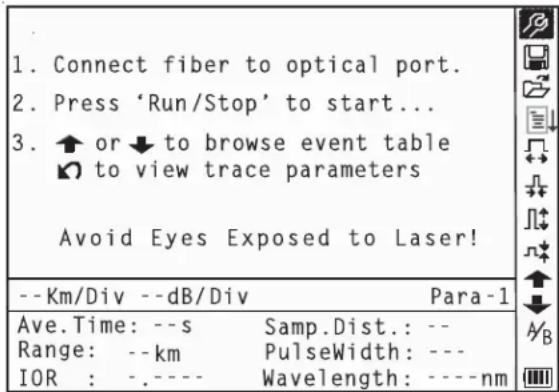
text_image
1. Connect fiber to optical port. 2. Press 'Run/Stop' to start... 3. ↑ or ↓ to browse event table ✓ to view trace parameters Avoid Eyes Exposed to Laser! --Km/Div --dB/Div Para-1 Ave.Time: --s Samp.Dist.: -- Range: --km PulseWidth: --- IOR : ----- Wavelength: ----nmFigure 4-2. Quick Reference Screen
Trace Measurement
One complete trace can be obtained for each measurement. The 930XC can also load a saved trace.
| ▲CAUTION |
| Instrument damage hazard:Make sure that the optical fiber or cable is not in use and there is no laser beam in the fiber before testing with this unit.Failure to observe this precaution may result in injury and may damage the unit. |
Setup
Connect the optical fiber directly to the 930XC optic output. No tools are required.
- Clean the connectors. Refer to Section 5 of this manual for details.
- Clean the tie-ins, making sure they are compatible (APC or UPC).
- Connect optical fiber to the 930XC.
For details relating to parameter configuration, refer to "Parameter Configuration" in Section 3. If the parameters are unclear, use the default parameters of the instrument.
Note: Range is set to "Auto" when auto measurement is on.
Auto Trace Measurement
Auto measurement can be used if the length of optical fiber is unknown. The 930XC will select an adequate range for measurement.
For auto measurement follow these steps:
- Set the range to "Auto." Refer to "Parameter Configuration" in Section 3.
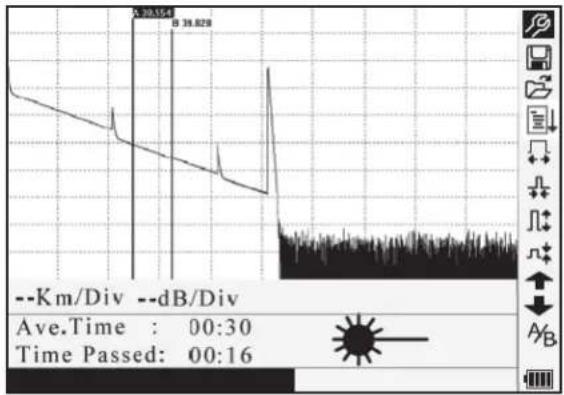
- Press Run/Stop to start the measurement (Figure 4-3).
line
| Time | Value | |------|-------| | 00:30 | 38.629 |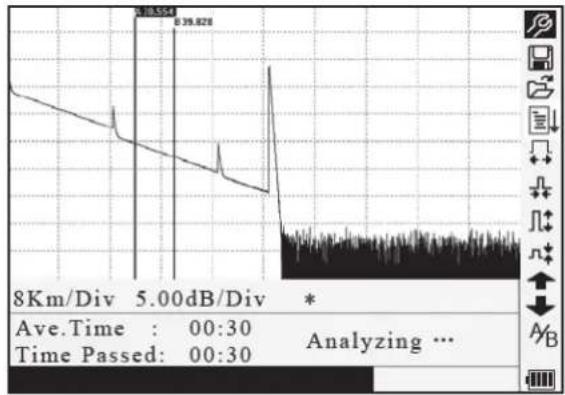
line
| Time | Value | |------|-------| | Peak | 39.828 | | Avg.Time | 00:30 | | Time Passed | 00:30 | | Analyzing ... | - |Figure 4-3. Measuring
3. Interface:
- Ave. Time: 00:30: Measure time, which is set by user, is 30 seconds.
• Time Elapsed: 00:16: Total measurement time has passed 16 seconds.
• : Thinking of this icon means laser is active.
Note: After a certain period of time, the trace displays on the GUI. The trace in the figure below is a trace during measurement, which will be refreshed for every certain period of time to demonstrate the whole process in realtime. But at the end of measurement the trace will be complete, as shown in Figure 4-4.

line
| Metric | Value | |--------|-----------| | No. | 2/4 | | Refl. | -38.12dB | | Ins.L | 0.85dB | | Attn. | 0.22dB/km |Figure 4-4. Trace Measurement
Manual Trace Measurement
To achieve optimal measurement results, set the parameters manually.
- Set the range. Refer to "Range Configuration" in Section 3.
- Press Run/Stop to start the measurement. The process is the same as with auto measurement.
Live Traffic Warning
Connect the optical fiber directly to the 930XC optic output. No tools are required. If the 930XC is connected to a fiber with live traffic, the warning of "Traffic Signal Detected!" will be displayed after Run/Stop is activated. Disconnect the fiber under test and quit the measurement. To avoid damage to the 930XC, ensure that live traffic is removed from the test fiber before reconnecting to the 930XC.

text_image
1. Connect fiber to optical port 2. Press 'Run/Stop' to start 3. Traffic Signal Detected ! Quit Avoid Eyes Exposed to Laser ! --Km /Div --dB /Div Para-1 Ave.Time: --s Samp. Dist.: -- Range: --km Pulse Width: --- IOR : ---- Wavelength: ----nmFigure 4-5. Live Traffic Warning
Reasons for Trace Measurement Failures
Figure 4-5. Live Traffic Warning
If measurement failures occur, the reason may be one of the following:
- Events may be too close to each other: Shorten the pulse width and try again. If failure still occurs, try measuring at the other end of the optical fiber.
- Low SNR: Use a wider pulse or increase average time and try again.
- Incorrect parameter configuration: Check the parameter configuration and try again.
Information Window
The information window displays the following items: measurement parameters, analysis parameters, and information regarding marker A/B.
For details regarding the information window, refer to "Information Window" in Section 3.
Switching between Information Window Items
Under GUI (Figure 4-4) press and the items in the information window will display in this order: measurement parameters analysis information events list marker A/B information fiber information measurement parameters.
Reviewing Events List
Under GUI (Figure 4-4) press ↗ until the events list information appears in the information window.
Use ▲ and ▼ to highlight ↑ or ↓, and then press Enter to review the events list. Use ↑ to browse upward, and ↓ to browse downward. To browse up and down the events list using the keypad, press Shift + and Shift + Enter.
Reviewing Marker A/B Information
Switching between Marker A/B
Under GUI (Figure 4-4) use ▲ and ▼ to highlight A/β, and then press Enter to switch between marker A/B.
Use ◀ and ▶ to move marker A or B.
Information between Marker A/B
Under GUI (Figure 4-4) press ▶to switch information window to marker A/B information.
Use ◀ and ▶ to move marker A or B.
Zoom a Trace
Zoom out Trace Horizontally
To review the details of an event more closely, follow these steps:
- Under GUI (Figure 4-4) use ▲ and ▼ to highlight ⚡, and then press Enter to zoom out the trace horizontally.
- Use ◀ or ▶ to move the marker to the event point being reviewed.
- Refer to "Switching between Marker A/B" above for more information.
Zoom in Trace Horizontally
Under GUI (Figure 4-4) use ▲ and ▼ to highlight ↩, and then press Enter to zoom out the trace vertically.
Zoom out Trace Vertically
To review the details of an event more closely, follow these steps:
- Under GUI (Figure 4-4) use ▲ and ▼ to highlight ☐, and then press Enter to zoom out the trace vertically.
- Use ◀ or ▶ to move the marker to the event point being reviewed.
- Refer to "Switching between Marker A/B" above for more information.
Zoom in Trace Vertically
Under GUI (Figure 4-4) use ▲ and ▼ to highlight ⌘, and then press Enter to zoom in the trace vertically.
Zooming Shortcuts
• To zoom in horizontally using the keypad, press Shift + ▶.
• To zoom out horizontally using the keypad, press Shift + ◀.
• To zoom in vertically using the keypad, press Shift + ▲.
- To zoom out vertically using the keypad, press Shift + Enter.
Re-analyze a Trace
If the test result at a certain threshold is not adequate, it can be re-analyzed using this function to change the threshold. This function can be effective while the OTDR is disconnected from the fiber.
Under the parameter configuration menu edit the threshold value, and then press ↩ to exit the parameter configuration menu. Press ↓ to re-analyze the trace.
Save a Trace
When auto or manual measurement is finished, the measurement trace can be saved. The contents of a saved trace include the trace curve and related information of the trace.
- Under GUI (Figure 4-4) use ▲ and ▼ to highlight ☐, and then press Enter to enter (Figure 4-6).

text_image
Space Used:118/1000 TRACE0 ABCDEFGHIJKLM NOPQRSUVWXYZ 0123456789_ Save Cancel Del Avg.Time: 30s Samp.Dist.: 5.11m Range: 80km PulseWidth: 2.5us IOR : 1.4666 Wavelength: 1550nmFigure 4-6. Save a Trace
- Input file name: Use ▲, ▼, ◀, and ▶ to choose the alphanumeric characters one by one, and then press Enter to confirm. The filename can be a maximum of eight characters in length.
- Save file: Use ▲, ▼, ◀, and ▶ to highlight "OK," and then press Enter to save.
- Cancel saving file: Use ▲, ▼, ◀, and ▶ to highlight "Cancel," and then press Enter to cancel the save file operation.
- Delete alphanumeric characters: Use ▲, ▼, ◀, and ▶ to highlight "Delete," and then press Enter to delete the characters.
- Memory space: "118/1000" means that total memory space is 1000 files; 118 files have been saved so far.
Browse Saved Traces
- Under GUI (Figure 4-4) use ▲ and ▼ to highlight 📋, and then press Enter to confirm (Figure 4-7).

text_image
Select File: 118/1000 Trace001 27-May-2013 10:30 Range: 80km Pwidth: 2.5us Wavelength.: 1550nm Open Cancel 8K Av Trace007 Trace008 Range: 80km PulseWidth: 2.5us IOR : 1.4666 Wavelength: 1550nmFigure 4-7. Browse Saved Traces
- Use ▲ and ▼ to highlight the trace, and then use ◀ and ▶ to choose "Open" or "Cancel." Press Enter to confirm.
- Memory space: "118/1000" means that total memory space is 1000 files; 118 files have been saved so far.
Alter Measurements in Realtime Testing
To alter measurements in realtime testing, follow these steps:
- Use ▲ and ▼ to highlight ⚙ (i.e., parameter configuration), and then press Enter. A parameter box will appear at the bottom of the screen.
- Use ◀ and ▶ to move to the parameter to be changed (Figure 4-9), and then press Enter.
- Use ▲ and ▼ to change the value. Select "Averaging" to choose Averaging testing.
- Press "OK" to exit the parameter configuration menu.

line
| Metric | Value | | ---------------- | --------- | | Range | 80 km | | Pulse Width | 2.5 us | | Wavelength | 1550 nm | | IOR | 1.4666 | |Figure 4-9. Alter Measurements in Realtime Testing
Power Meter, Laser Source, and VFL Settings
Optical Power Meter Settings
- Enter PM/LS interface as described in "Power Meter, Laser Source, and VFL Configuration" in Section 3. Use ▲ and ▼ to highlight "OPM", and press Enter to enter OPM interface (Figure 4-10)

text_image
CW 1310nm Ref: -10:00dBm -20.185 dBmFigure 4-10. Optical Power Meter
- Use ◀ and ▶ to toggle between calibrated wavelengths. Press Enter to enter OPM measurement setting interface (Figure 4-11)
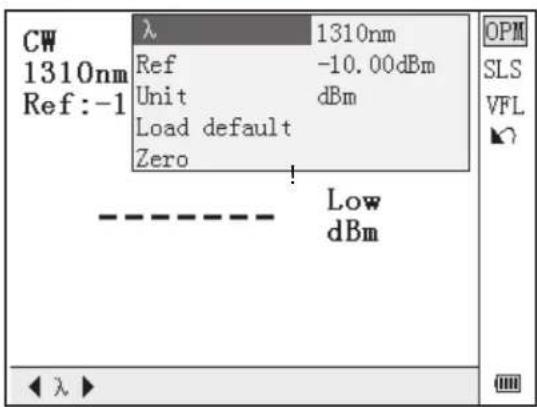
text_image
CW 1310nm Ref:-1 λ 1310nm Ref -10.00dBm Unit dBm Load default Zero Low dBm OPM SLS VFL ↓ ← λ ►Figure 4-11. OPM Measurement Setting
- Use ▲ and ▼ to highlight the parameter to be adjusted, and press Enter to enable adjustment. Press ◀ and ▶ to adjust digit position, and press ▲ and ▼ to adjust the value. Press Enter again to confirm and press ↩ to exit setting.
Zeroing the Optical Power Meter
- Isolate OPM port from outside light input with dust cap tightened securely.
- Enter "Setup" and find "PM/LS".
- Enter "PM/LS" and select "OPM".
- In OPM interface, press Enter to find OPM popup menu.
- Find "Zero", and press Enter to zero the OPM.
Stabilized Laser Source Settings
- Enter PM/LS interface as described in "Power Meter, Laser Source, and VFL Configuration" in Section 3. Use ▲ and ▼ to highlight "SLS", and press Enter to enter SLS interface (Figure 4-12).

text_image
PCW 1310nm Laser Off ◀ λ ▶ OPM SLS VFL ◀Figure 4-12. Stabilized Laser Source
- Use ◀ and ▶ to toggle between SLS working wavelengths. Press Enter to enter SLS setting interface (Figure 4-13).
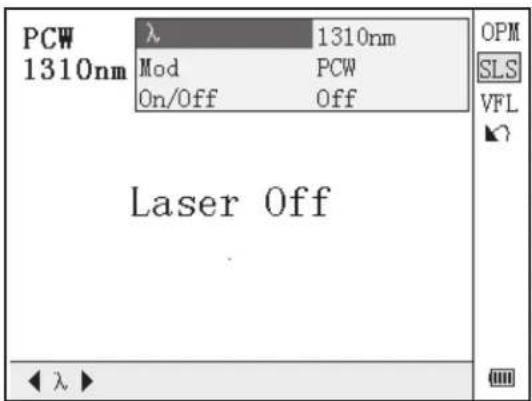
text_image
PCW 1310nm λ 1310nm Mod PCW On/Off Off Laser Off OPM SLS VFL ◀ λ ▶Figure 4-13. Stabilized Laser Source Setting
- Use ▲ and ▼ to highlight the parameter to be adjusted, press Enter to confirm, and press ↗ to exit setting.
Visible Fault Locator Settings
- Enter PM/LS interface as described in "Power Meter, Laser Source, and VFL Configuration" in Section 3. Use ▲ and ▼ to highlight "VFL", and press Enter to enter VFL interface (Figure 4-14).
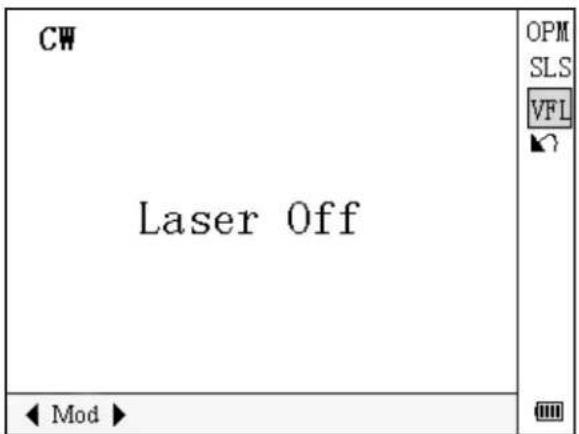
text_image
CW Laser Off ◀ Mod ▶ OPM SLS VFL ?Figure 4-12. Stabilized Laser Source
- Use ◀ and ▶ to toggle between VFL working modes. Press Enter to enter VFL setting interface (Figure 4-15).
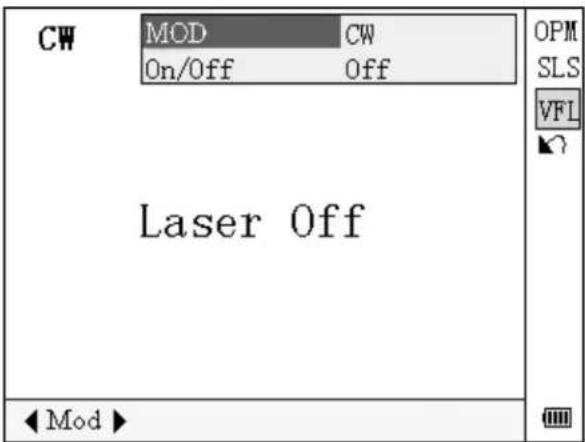
text_image
CW MOD On/Off CW Off Laser Off OPM SLS VFL ↓ Mod ▶Figure 4-15. Visible Fault Locator Setting
- Use ▲ and ▼ to highlight the parameter to be adjusted, press Enter to confirm, and press ↖ to quit setting.
930XC Link Viewer
Macrobend Analysis will find events that are high losses at 1550nm and little or no loss at 1310nm. To activate this feature set the Wavelength setting to 1310+1550nm.
Display Mode
Link Viewer is a graphical way of presenting OTDR test results. The user can manually switch between Link Viewer mode and Trace mode by toggling the Display Mode setting as shown below.
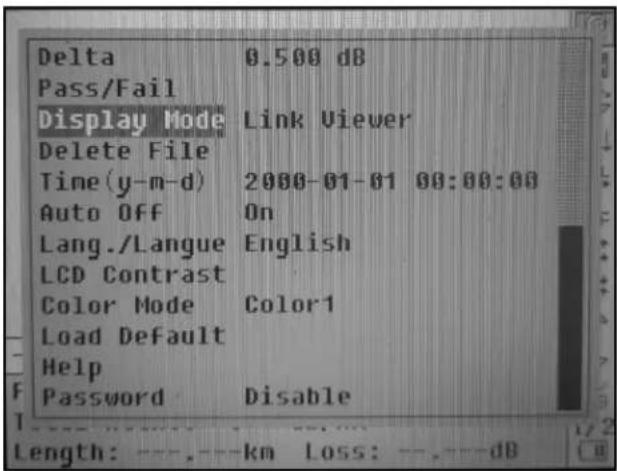
text_image
Delta 0.500 dB Pass/Fail Display Mode Link Viewer Delete File Time (y-m-d) 2000-01-01 00:00:00 Auto Off On Lang./Langue English LCD Contrast Color Mode Color1 Load Default Help Password DisableThe test settings in Link Viewer mode are the same as in Trace mode, parameters as Range, Pulse Width, Measuring Mode (Averaging/ Real Time), Time, IOR etc. need proper configuration for reasonable test results. The user can start a test either in Link Viewer Mode or Trace Mode. In Link Viewer mode, OTDR test results are presented in a way shown below.
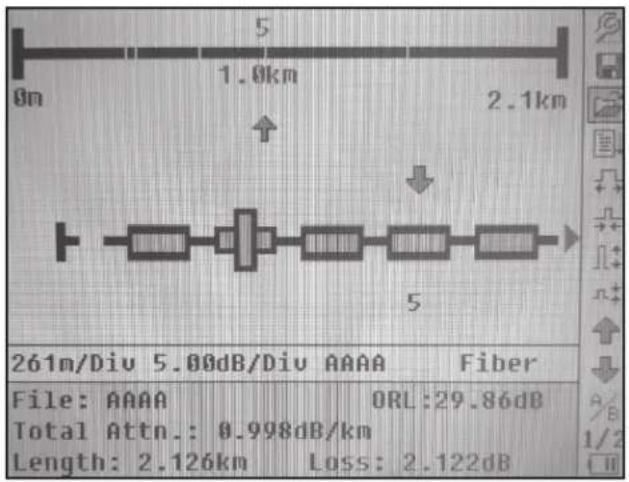
text_image
5 1.0km 2.1km 261m/Div 5.00dB/Div AAAA Fiber File: AAAA ORL:29.86dB Total Attn.: 0.998dB/km Length: 2.126km Loss: 2.122dBEvents are presented by icons in link view, viewing each one of the events is the same as in trace view with the same hot keys. The symbol 🖼 indicates the selected event with event number. The overall fiber link information is shown in the black line pictorial above the event link with relative position marks (white vertical lines) and distance information (total length and location of selected event).
Events Summary

Beginning of fiber

Splice

Connector / Coupler

Macrobend

End of fiber
Events will be highlighted if the respective event is greater than the relevant setting in the Pass/Fail menu.
Pass/Fail Setup
Pass/Fail settings are accessed as shown below.

text_image
Meas.Mode Averaging PM/LS Length Units Meter[m] IOR Scat.Coef. NRefl.Thre. 0.200 dB Refl.Thre. -56.00 dB End Thre. 3.000 dB Delta 0.500 dB Pass/Fail Display Mode Trace Delete File
text_image
1. Connect fiber to optical port 2. Press 'Run/Stop' to start ... Ins. Loss 0.10 dB Reflectance 60 dB Total Attn. 0.500 dB/Km Total Loss 5.00 dB Total ORL 30 dB Thres. On/OFF On --KM/DIO --OB/DIO Fiber File: * ORL: -.--dB Total Attn.: -.---dB/km Length: ---.---km Loss: ---.---dBPass/Fail Settings
Ins. Loss
Measured events with insertion loss greater than this setting will be displayed red.
Reflectance
Measured events with reflectance greater than this setting will be displayed red.
Total Attn.
Measured links with a total attenuation greater than this setting will be displayed in red.
Total Loss
Measured links with a total loss greater than this setting will be displayed in red.
Total ORL (Optical Return Loss)
If the total ORL for the link is equal to or greater than this setting the link will be displayed red.
Thres. On/Off
Enable / Disable Pass/Fail function. On provides Pass/Fail analysis. Off disables the analysis.
Macrobend Analysis
Macrobend Analysis will find events that are high losses at 1550nm and little or no loss at 1310nm. To activate this feature set the Wavelength setting to 1310+1550nm.
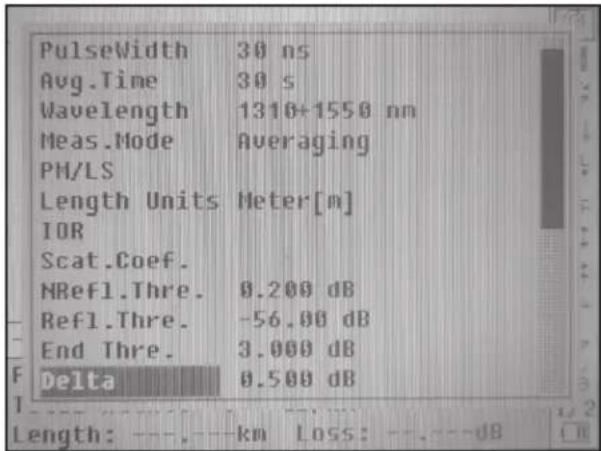
text_image
PulseWidth 30 ns Avg.Time 30 s Wavelength 1310+1550 nm Meas.Mode Averaging PH/LS Length Units Meter[m] IOR Scat.Coef. NRefl.Thre. 0.200 dB Refl.Thre. -56.00 dB End Thre. 3.000 dB Delta 0.500 dB Length: ----km Loss: ----dBUse the Delta to set the Macrobend sensitivity. Lower Deltas will find progressively smaller Macrobends. Please note when single wavelength is selected, Delta is not available for setting. Macrobend analysis is not available in 1310nm and 1550nm measurements.
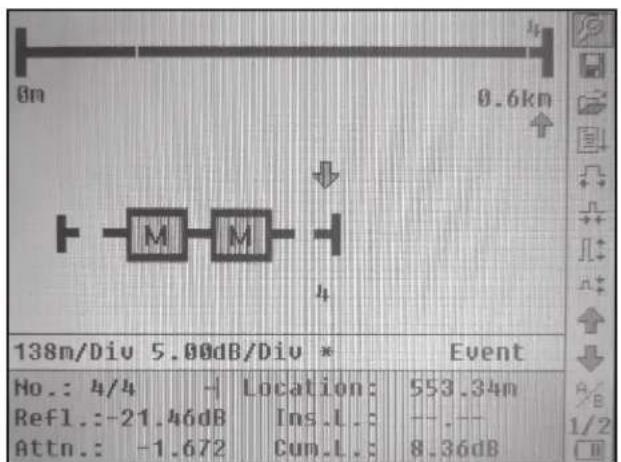
text_image
8n 0.6kn M M 138m/Div 5.00dB/Div * Event No.: 4/4 H Location: 553.34n Refl.: -21.46dB Ins.L: -- Attn.: -1.672 Cun.L.: 8.36dBThe screenshot below shows the same measurement in conventional Trace mode.
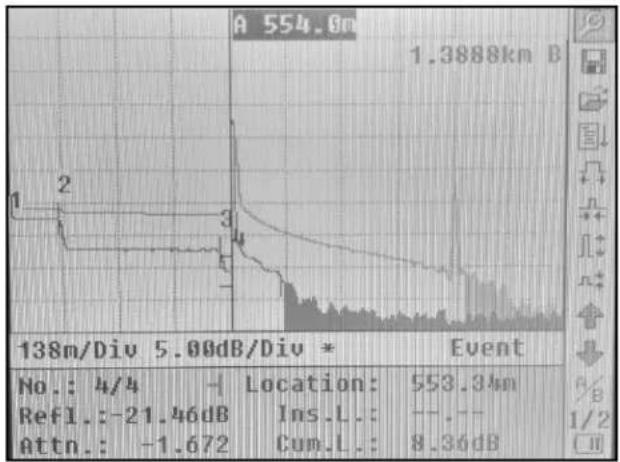
line
| Event | Value | |-------|-----------| | 138m/Div | 5.00dB/Div | | 1.3888km B | 554.00 | | 1/2 | 1.3888km B |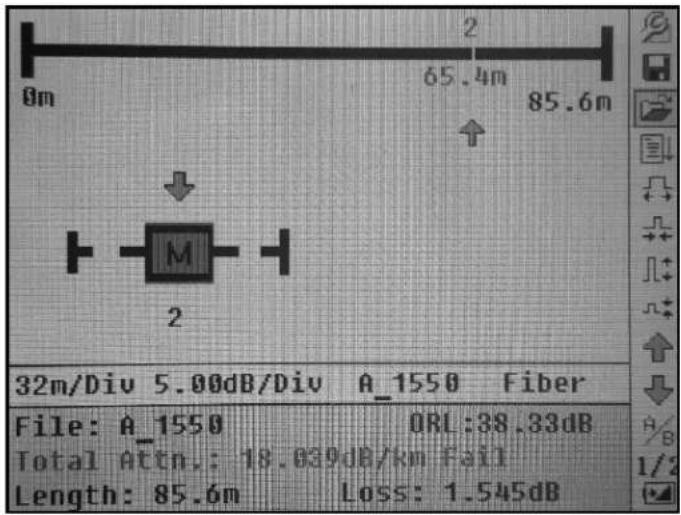
text_image
0m 65.4m 85.6m ↓ M 2 32m/Div 5.00dB/Div A_1550 Fiber File: A_1550 ORL:38.33dB Total Attn.: 18.039dB/km Fail Length: 85.6m Loss: 1.545dBSection 5. Calibration and Maintenance
CAUTION
Electric shock hazard:
- Do not expose the unit to extremes in temperature or high humidity. Refer to "Specifications."
- Turn the unit off, disconnect from power, and make sure the laser source is off before cleaning.
Failure to observe these precautions may result in injury and may damage the unit.
Calibration Requirements
Calibration of the instrument is recommended every two years. Contact Tempo for proper calibration services.
Maintenance and Replacement of Batteries
The 930XC has two batteries: a NiMH battery to power the instrument and a realtime clock (RTC) battery for data retention.
Note: Recharge the battery prior to use if the OTDR has not been used for one month.
To replace the NiMH battery (Figure 5-1):
- Remove the battery compartment cover.
-
Remove the battery and disconnect the battery connector.
-
Replace the battery with the Tempo supplied replacement battery.
To replace the RTC battery (Figure 5-1):
- Remove the NiMH battery as above.
- Remove the RTC coin cell battery.
- Replace using a CR1220. Insert the replacement coin cell with the positive side facing up.

text_image
Jack for Chargeable Battery Chargeable Battery RTC Clock BatteryFigure 5-1. Replacing Battery
Cleaning
When necessary, clean the case, front panel, and rubber boot with a damp cloth. Do not use abrasives, harsh chemicals, or solvents.
Before Cleaning
- Make sure the power is off to the instrument.
- Make sure the laser source is off when cleaning any optical connectors.
- Make sure AC power is disconnected.
Cleaning Interfaces and Connectors
Interfaces must be kept clean. Isopropyl alcohol may be used to clean the optical output. Always replace the protective dust caps when the unit is not being used, and keep the protective dust caps clean. In addition, flanges must be cleaned periodically.
Notes:
- The diameter of optic core is 9 um, and the diameter of dust and other particulates ranges from 1/100 to 1/1000 um. Dust and other particulates can cover part of the optical end and therefore degrade the performance of the instrument.
- In addition, power density may burn dust into optical fiber and induce further damage (for example, 0 dBm optic power may produce about 16000000 W/m*m power density in single mode fiber). If this happens, the measurement will be inaccurate and damage will be irreversible.
Tools for Cleaning Interfaces and Connectors
• Optical fiber cleaner (for cleaning optical connectors)
• Optical fiber cleaning rod (for cleaning optical outputs)
• Optical fiber cleaning tissue (for cleaning optical interfaces)
- Isopropyl alcohol
- Paper tissue
- Cleaning brush
- Cleaning swabs
- Condensed air
Procedure for Cleaning Interfaces and Connectors
- Unscrew the adapter from the bulkhead.
- Carefully clean the bulkhead and the inside of the adapter.
- Screw the adapter back onto the bulkhead.

Figure 5-2. Flange
Section 6. Specifications
| MODEL | 930XC-20C 93 | 0XC-30P 930XC- | 30F 930XC-20M | |
| Wavelength (±20nm) | 1310/1550 1310/1 | 490/1550 1310/1550/162 | 5 850/1300 | |
| Dynamic Range (dB)a | 35 38/37/37 38/37/37 21/24 | |||
| Event Deadzone (m)b | 1m | 1m | 1m | ≤2.5m |
| Attenuation Deadzone | 4.5m 4.5m 4.5m | ≤12m | ||
| Pulsewidth | 5, 10, 30, 100, 300, 1us, 2.5us, 10us, 20us 12, 30, 100, 275, | 1us/30, 100, 275, 1us, 2us | ||
| Selectable Ranges (km) | 0.3, 1.3, 2.5, 5, 10, 20, 40, 80, 120, 160, 240 0.1, 0.3, 0.5, 1.3, | 2.5, 5, 0/0.1, 0.3, 0.5, 1.3, 2.5, 5, 10, 20, 40, 80 | ||
| Average Time | 15s/30s/1 min/2 min/3 min | |||
| Distance Measurement Accuracy | ±(1m + 5 X 10⁻⁵ x distance + sampling space) | |||
| Connector Type | PC or APC (interchangeable FC, SC, ST) | |||
| Reflection Detect Accuracy | ±4 dB | |||
| Attenuation Detect Accuracy | ±0.05 dB/dB | |||
| Measurement Data Storage | 1,000 test curves | |||
| Data Transmission RS-232/USB port | ||||
| Visual Fault Locator (VFL) | -3dBm; 650nm | |||
| Optical Power Meter (OPM) | InGaAs | |||
| OPM Wavelengths | 850, 1300, 1310, 1490, 1550, 1625nm | |||
| OPM Range | +6 to -70dBm (+6 to -60dBm 850nm) | |||
| OPM Display resolution | 0.01dB | |||
| OPM MOD Identification | 1kHz, 2kHz | |||
| Stabilized laser Source (SLS) | Wavelength same as selected in OTDR mode ≤ -7dBm | |||
| Power Supply | NiMH chargeable battery/AC adapter | |||
| Battery Life | Support over 8 hours operating on onecharge or over 20 hours standby | |||
| Operating Temperature | -10° to 50°C | |||
| Storage Temperature | -20° to 60°C | |||
| Relative Humidity | 0 to 95% (non-condensing) | |||
| Weight | 1.9 lbs. (0.87 kg) | |||
| Dimensions | 7.7" H x 3.9" W x 2.4" L (196mm x 100mm x 64mm) | |||
| Compliance | BelCore GR196, CE, FCC, UL, WEEE | |||
| Fiber Analysis Software | Version 3.2 | |||
Stabilized Laser Source Module
| Specification 930XC | -20C 930XC-20M 930XC | -30F 930XC-30P | ||
| Wavelength Same as OTDR working wavelength | ||||
| Output Power (dBm) ≥ -7 | ||||
Optical Power Meter Module
| Specification 930XC | -20C 930XC-20M 930XC | -30F 930XC-30P | ||
| Calibrated Wavelength (nm) 850/1300/1310/1490/1550/1625 | ||||
| Power Range (dBm) -70 ~ +6 (-60 ~ +6 @ 850 nm) | ||||
| Detector Type InGaAs | ||||
| Display Resolution (dB) 0.01 | ||||
| Accuracy ±5% ±0.01 nW (±0.5 dB @ 850 nm) | ||||
| MOD Identification 1 K, 2 K Hz | ||||
Section 7. OTDR Trace Viewer Software
Trace Viewer software is an application developed for the 930XC OTDR. It allows the previously stored measurement records in the instrument to be uploaded to a PC and to be displayed, saved, or printed. This software provides a convenient data management function, which includes: editing, analysis, browsing, saving, backup, printing, and ASCII format output.
Software Installation
Computer System Requirements
Requirements for operating system and hardware:
• PC with Intel Pentium III processor or higher
- Microsoft® Windows 98/2000/XP/Vista/7/8 operating system
• Minimum 64 MB of internal memory
• Minimum 40 MB of available hard disk space
• 8-speed CD-ROM drive
• 9-pin series port or USB port
Installation
Follow these steps to install the 930XC OTDR Trace Viewer software on a PC:
- Start Microsoft ^® Windows.
- Exit all other running applications that Windows is currently running.
- Insert the installation disk into the CD-ROM drive, and locate the OTDR Trace Viewer folder.
- Run 930XC OTDR Trace Viewer setup file to install.
- Follow the step-by-step installation wizard instructions until installation is complete.
Software GUI
Graphical User Interface (GUI)
After installing the 930XC Trace Viewer software, click "run" to view the main GUI (Figure 7-1).
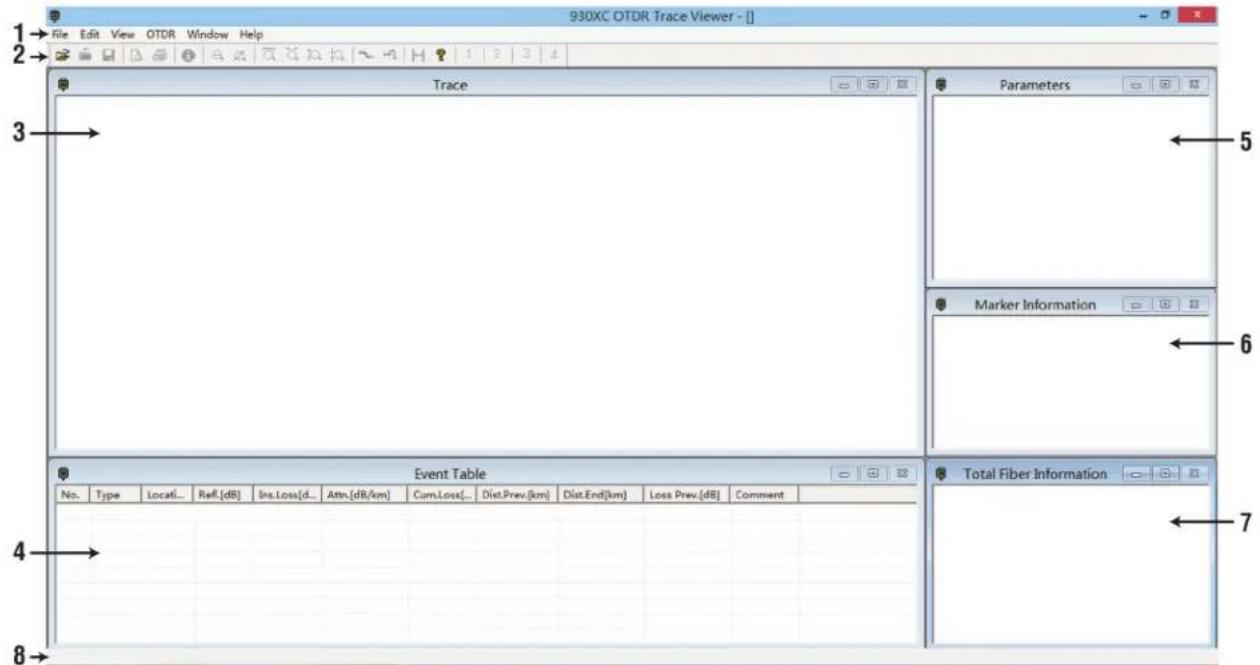
text_image
930XC OTDR Trace Viewer - [] File Edit View OTDR Window Help Trace Parameters Marker Information Event Table Total Fiber Information No. Type Locati... Ref.[dB] Ins.Loss[d... Attr.[dB/km] Cum.Loss[... Dist.Prev[km] Dist.End[km] Loss Prev.[dB] Comment 4 7Figure 7-1. GUI
- Menu
- Tool bar
- Trace display window (Spectral line)
- Events list window (Events Table)
- Measurement and analysis parameter window (Parameter Sheet)
- Fiber information window (Fiber section information)
- Fiber chain information window (Fiber chain information)
- Status bar
Menu, Tool Bar, and Status Bar
The main GUI of the 930XC OTDR Trace Viewer software is shown in Figure 7-1.
The menu bar includes: File, Edit, View, OTDR, Window, and Help.
The tool bar is right below the menu bar. Use the mouse pointer to highlight a tool, and the operation reference will pop up. The tool bar display can be turned on or off by clicking "Show Toolbar" under the "View" menu. The tool bar provides shortcut keys to complex operations. All the functions on the tool bar can also be accessed through the menu bar.
The status bar is at the very bottom of the GUI. It displays information or reference of the current menu or tool bar application. The status bar is a brief summary of the current menu application or tool bar function.
File (F)
The functions enabled under the "File" menu (Figure 7-2) include: Upload Trace File, Open, Multi-traces (add up to four traces to display), Save, Save As, ASCII Export, Print Option, Printing Preview, Print, Batch Print Preview, Batch Print, Batch Edit, and Exit.
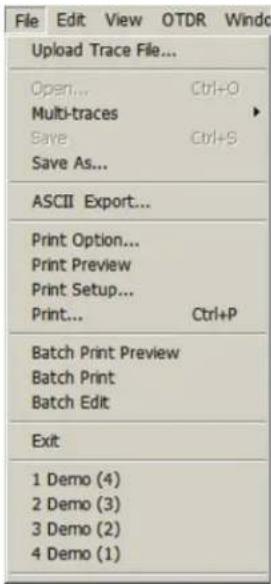
text_image
File Edit View OTDR Windc Upload Trace File... Open... Ctrl+O Multi-traces Save Ctrl+S Save As... ASCII Export... Print Option... Print Preview Print Setup... Print... Ctrl+P Batch Print Preview Batch Print Batch Edit Exit 1 Demo (4) 2 Demo (3) 3 Demo (2) 4 Demo (1)Figure 7-2. File Menu
Edit (E)
Use the “Edit” menu (Figure 7-3) to edit the events list: Add Event, Modify Event, Delete Event and Edit Trace (optical fiber) Information. Optical fiber information is explanatory text relating to the trace file that users type in. For each measurement, users can save the measurement trace with the 930XC. This software provides an interface for text input. For each trace file, users can input related information (No. of cable, No. of fiber, type of fiber, beginning of fiber, end of fiber, manufacturer, and technician. With this information, users can identify the corresponding relations between trace file and fiber chain.
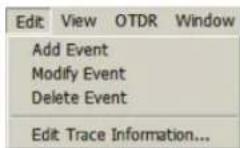
Figure 7-3. Edit Menu
View (V)
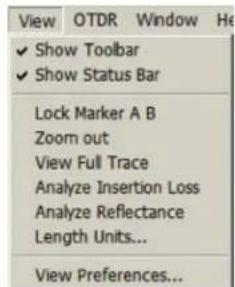
The "View" menu (Figure 7-4) controls the display of the tool bar, status bar, marker operation and trace display (zoom in and out horizontally and vertically), and the display style of the trace.
text_image
View OTDR Window He ✓ Show Toolbar ✓ Show Status Bar Lock Marker A B Zoom out View Full Trace Analyze Insertion Loss Analyze Reflectance Length Units... View Preferences...Figure 7-4. View Menu
A trace is composed of many dots. To review the details of a trace, zoom in by drawing square with mouse on selected trace area from upper left to lower right direction and zoom out by drawing square from any other direction.
Lock Marker A and B to fix the distance between them.
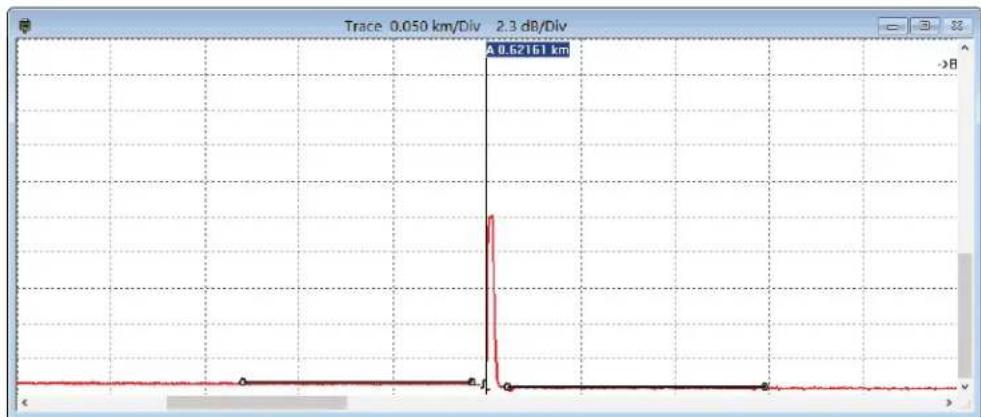
Use "Analyze Insertion Loss" function to manually calculate the insertion loss of an event (Figure 7-5).
line
| X Position | Y Value | | ---------- | ------- | | A | 0.62161 | | B | 0.050 |Figure 7-5. Analyze Insertion Loss
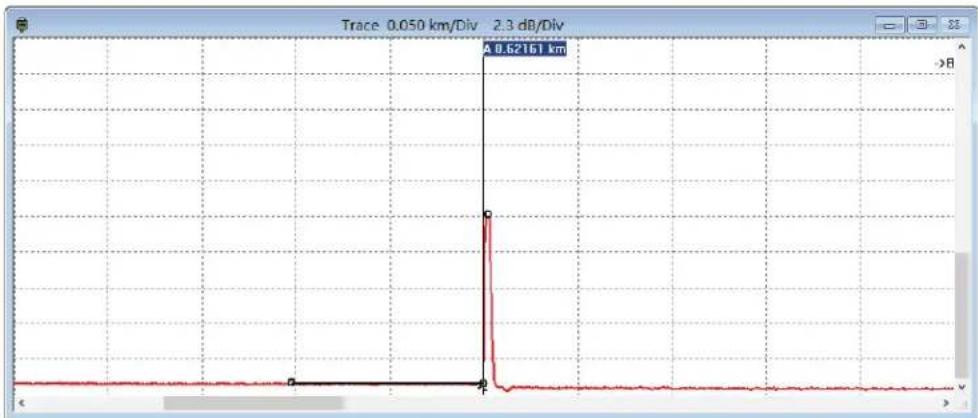
Use "Analyze Reflectance" function to manually measure the reflectance of reflection event (Figure 7-6).
line
| X Position | Y Value | | ---------- | ------- | | A | 0.62161 | | B | 0.050 |Figure 7-6. Analyze Reflectance
Use the "Length Units" setting to select meters, feet, or miles as the unit of measurement. Note: When the Trace Viewer application is opened, this setting defaults to the last unit of measurement selected.
View Preferences refers to the trace display styles. Trace can be displayed in dots or solid line; dashed line displays or not; selection of the event status bar.
OTDR (O)
The “OTDR” menu (Figures 7-7 and 7-8) provides a reanalysis function for acquired traces. Operator can modify IOR, Scatter Coefficient, and event thresholds (Non-reflection, Reflection, and End) per each wavelength to review correct results.
Figure 7-7. OTDR Menu

text_image
ReAnalysis Trace Acquisition Fiber Settings WaveLength 1550nm IOR 1.4666 Default Scat. Coef[dB] -52.1 Default Analysis Parameters Non-Reflection Threshold 0.2 dB Default Reflection Threshold -56 dB Default End Threshold 3 dB Default Apply CancelFigure 7-8. Trace Reanalysis
Window (W)
The “Window” menu (Figure 7-9) controls the display of the subwindows: trace window, events table window, parameter window, and fiber chain information. Tile function displays subwindows in a layout similar to Figure 7-1. Other submenus take the selected window as the current active window.

text_image
Window Help Cascade ✓ Trace EventTable Parameters Marker Information Total Fiber InformationFigure 7-9. Window Menu
Help (H)
The "Help" menu (Figure 7-10) displays the version of the software.

text_image
Help About OTDR Trace View...Figure 7-10. Help Menu
Information Subwindows
Trace Display Window
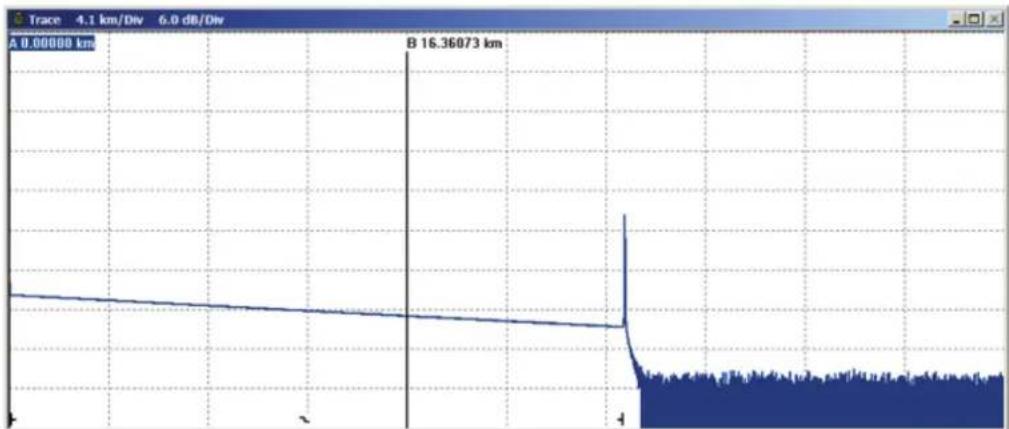
Click “Open…” under the “File” menu to open a trace file, and a trace curve will display in the trace display window (Figure 7-11). The x-axis displays the distance (km); the y-axis represents the backscatter power (dB). There are two markers, A and B; click either one to activate it. To move the marker, click and drag with the mouse pointer; the position information will change accordingly. By moving the marker, the horizontal distance and vertical power can be read manually. Zooming in and out of the trace features depends on the activation of a marker. In Figure 7-11 below, the sloped line represents backscatter from the optical fiber. The peaks are reflective events in the fiber chain. The end of the fiber is shown by the sudden drop in optical power, which is followed by noise. The symbols at the bottom of the window indicate the type of event.
line
| Time (s) | Amplitude (dB) | | -------- | -------------- | | 0 | 0.00000 | | 1 | 0.00000 | | 2 | 0.00000 | | 3 | 0.00000 | | 4 | 0.00000 | | 5 | 0.00000 | | 6 | 0.00000 | | 7 | 0.00000 | | 8 | 16.36073 | | 9 | ~0.5 | | 10 | ~-1.5 | | 11 | ~-2.5 | | 12 | ~-3.5 | | 13 | ~-4.5 | | 14 | ~-5.5 | | 15 | ~-6.5 | | 16 | ~-7.5 | | 17 | ~-8.5 | | 18 | ~-9.5 | | 19 | ~-10.5 | | 20 | ~-11.5 | | 21 | ~-12.5 | | 22 | ~-13.5 | | 23 | ~-14.5 | | 24 | ~-15.5 | | 25 | ~-16.5 | | 26 | ~-17.5 | | 27 | ~-18.5 | | 28 | ~-19.5 | | 29 | ~-20.5 | | 30 | ~-21.5 | | 31 | ~-22.5 | | 32 | ~-23.5 | | 33 | ~-24.5 | | 34 | ~-25.5 | | 35 | ~-26.5 | | 36 | ~-27.5 | | 37 | ~-28.5 | | 38 | ~-29.5 | | 39 | ~-30.5 | | 40 | ~-31.5 | | 41 | ~-32.5 | | 42 | ~-33.5 | | 43 | ~-34.5 | | 44 | ~-35.5 | | 45 | ~-36.5 | | 46 | ~-37.5 | | 47 | ~-38.5 | | 48 | ~-39.5 | | 49 | ~-40.5 | | 50 | ~-41.5 | | 51 | ~-42.5 | | 52 | ~-43.5 | | 53 | ~-44.5 | | 54 | ~-45.5 | | 55 | ~-46.5 | | 56 | ~-47.5 | | 57 | ~-48.5 | | 58 | ~-49.5 | | 59 | ~-50.5 | | 60 | ~-51.5 | | 61 | ~-52.5 | | 62 | ~-53.5 | | 63 | ~-54.5 | | 64 | ~-55.5 | | 65 | ~-56.5 | | 66 | ~-57.5 | | 67 | ~-58.5 | | 68 | ~-59.5 | | 69 | ~-60.5 | | 70 | ~-61.5 | | 71 | ~-62.5 | | 72 | ~-63.5 | | 73 | ~-64.5 | | 74 | ~-65.5 | | 75 | ~-66.5 | | 76 | ~-67.5 | | 77 | ~-68.5 | | 78 | ~-69.5 | | 79 | ~-70.5 | | 80 | ~-71.5 | | 81 | ~-72.5 | | 82 | ~-73.5 | | 83 | ~-74.5 | | 84 | ~-75.5 | | 85 | ~-76.5 | | 86 | ~-77.5 | | 87 | ~-78.5 | | 88 | ~-79.5 | | 89 | ~-80.5 | | 90 | ~-81.5 | | 91 | ~-82.5 | | 92 | ~-83.5 | | 93 | ~-84.5 | | 94 | ~-85.5 | | 95 | ~-86.5 | | 96 | ~-87.5 | | 97 | ~-88.5 | | 98 | ~-89.5 | | 99 | ~-90.5 | | 100 | ~-91.5 |Figure 7-11. Trace Display
Events List Window
Trace data collected by the 930XC will be processed automatically, and analysis results will be displayed in the events list (Figure 7-12).
| No. | Type | Locati... | Refl.[dB] | Ins.Loss[dB] | Attn [dB/km] | Cum.Loss[ ... | Dist.Prev. [km] | Dist.End[km] | Loss Prev. [dB] | Comment | |
| 1 | ✓ Start | 0.00000 | -46.300 | -.- | -.- | -.- | -.- | 25.29358 | -.- | ||
| 2 | ✓ No... | 12.22... | -.- | 0.005 | -0.555 | 4,827 | 12.22389 | 13.06969 | 4.827 | ||
| 3 | ✓ End | 25.29... | -23.907 | -.- | 0.191 | 0.000 | 13.06969 | -.- | -4.832 | ||
Figure 7-12. Events List
The events list contains the following items:
• No.: Sequence of events in optical fiber chain.
- Type: Beginning, end, reflection, and non-reflection event.
• Distance: Distance from OTDR to event point.
• Reflection Value: Value of reflection event.
- Insertion Loss: Vertical decline of dB.
• Cumulative Loss: dB value of loss from 0 km to current event point.
- Dist. Prev. (km): Distance from the previous event.
- Attenuation Coefficient: Value of attenuation per kilometer between current event point and previous event point in optical fiber chain.
• Dist. End. (km): Distance from the end event.
- Loss Prev. (dB): Loss from 0 km to current event point.
- Comment: Notify other details of the event.
Parameter Window
The parameter window (Figure 7-13) displays the default parameters of the currently displayed trace. Measurement parameters include: range, pulse width, average time, and wavelength. Analysis parameters include: IOR, scattering coefficient, end threshold, non-reflection threshold, reflection threshold, and samp. dist. For definitions of these parameters, refer to "Parameter Configuration" in Section 3 of this manual.
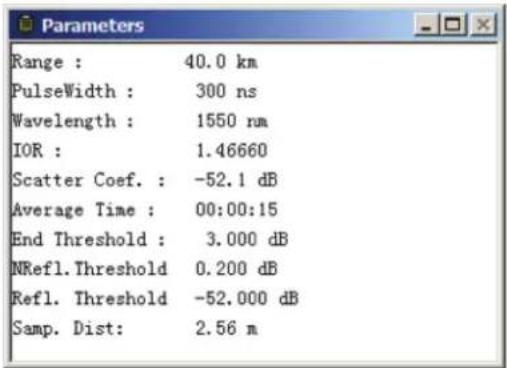
text_image
Range : 40.0 km PulseWidth : 300 ns Wavelength : 1550 rm IOR : 1.46660 Scatter Coef. : -52.1 dB Average Time : 00:00:15 End Threshold : 3.000 dB NRefl. Threshold 0.200 dB Refl. Threshold -52.000 dB Samp. Dist: 2.56 mFigure 7-13. Parameters
Fiber Section Information Window
This window (Figure 7-14) displays the distance between marker A and B, attenuation coefficient, and loss information. The two point loss is the difference of vertical power between marker A and B. Two point attenuation is the two point loss of marker A and B divided by the horizontal distance between marker A and B.
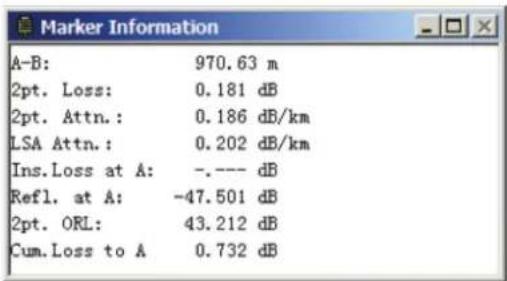
text_image
Marker Information A-B: 970.63 m 2pt. Loss: 0.181 dB 2pt. Attn.: 0.186 dB/km LSA Attn.: 0.202 dB/km Ins.Loss at A: -.--- dB Refl. at A: -47.501 dB 2pt. ORL: 43.212 dB Cum.Loss to A 0.732 dBFigure 7-14. Fiber Section Information
Fiber Chain Information Window
The contents displayed in this window (Figure 7-15) are date of measurement, length of fiber chain, loss of fiber, attenuation, ORL, and event number of fiber.
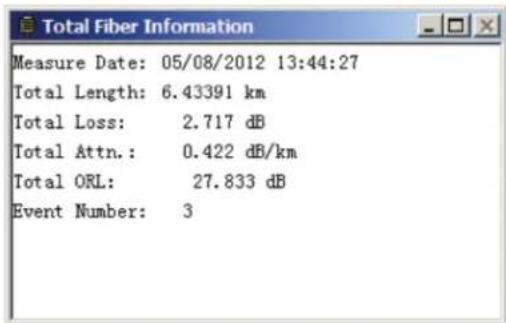
text_image
Measure Date: 05/08/2012 13:44:27 Total Length: 6.43391 km Total Loss: 2.717 dB Total Attn.: 0.422 dB/km Total ORL: 27.833 dB Event Number: 3Figure 7-15. Fiber Chain Information
Software Functions
Upload Trace Data
Option 1:
Power off the 930XC, and then connect the 930XC to a PC via USB cable. Turn the 930XC on and wait for PC to recognize 930XC as an USB memory device. Find "trace" folder to copy saved files to PC.
Option 2:
Power off the 930XC, and then connect the 930XC to a PC via serial cable. Turn the 930XC on and run the 930XC OTDR Trace Viewer software. Under the "File" menu, select "Upload trace file...", and the "Communications Settings" dialog box appears. Choose a communication port (RS-232) and click "OK". Choose the saved position of traces, and then start uploading data.
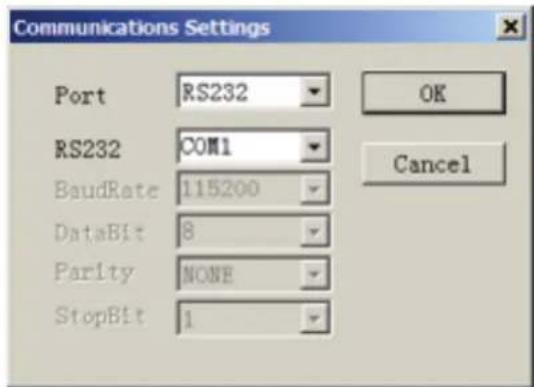
text_image
Communications Settings Port RS232 RS232 COM1 BaudRate 115200 DataBit 8 Parity NONE StopBit 1 OK CancelFigure 7-16. Upload Trace Data
Browse Traces
Tool Bar

text_image
Toolbar with icons representing file operations, image editing, and formatting toolsMove the mouse pointer over the tool bar and an explanation of the buttons will pop up. Their functions are as follows:

text_image
Open file Close file Save file Printing preview Printing Edit optical fiber information Zoom out trace Display whole trace Zoom in trace horizontally Zoom out trace horizontally Zoom in trace vertically Zoom out trace vertically Analyze insertion loss (the five-point measurement to test the insertion loss) Analyze reflectance Lock marker A and B Display version Trace number (in multi-trace display mode)Open Trace File
Select "Open trace file..." under the "File" menu, and choose the trace file to be reviewed (Figure 7-17). Select "Tile" under the "Window" menu to automatically rearrange the subwindows as shown in the figure below.

line
| Parameter | Value | | --------- | ----- | | Range | 40.0 km | | PulseWidth | 200 ns | | Wavelength | 1550 nm | | DOK | 1.46660 | | Scatter Coef. | -52.1 dB | | Average Time | 00:00:30 | | End Threshold | 3.000 dB | | NRef1 Threshold | 0.200 dB | | Ref1 Threshold | -52.000 dB | | Sump. Dist | 2.58 m | | Marker Information | A-B: 0.94052 km Dpt. Loss: 1.707 dB Dpt. Attn.: 0.191 dB/km LISA Attn.: 0.190 dB/km Ins.Loss at A: -2.448 dB Ref1. at A: -84.920 dB Dpt. ORL: 33.964 dB Cum.Loss to A: 4.757 dB | | Total Fiber Information | Measure Date: 03/26/2013 11:06:42 Total Length: 26.29368 km Total Loss: 4.749 dB Total Attn.: 0.188 dB/km Total ORL: 32.514 dB Event Number: 2Figure 7-17. Open Trace File
Zoom in and out of Trace
Trace curves are displayed in the trace window (Figure 7-17).
To view in more detail, drag the marker to the trace detail to be reviewed and then:
- Zoom in trace horizontally: Click on the tool bar.
- Zoom out trace horizontally: Click ➕ on the tool bar.
- Zoom in trace vertically: Click on the tool bar.
- Zoom out trace vertically: Click ⌘ on the tool bar.
• Whole trace: Click 📄 on the tool bar.
Or zoom in by drawing square with mouse on selected trace area from upper left to lower right direction, and zoom out by drawing square from any other direction.
Note:
- Zoom in or out is centered on the trace features of the activated marker.
- The software supports floating menu operation. Right click the mouse on the window in order to display the operations that can be performed, including zoom in and out of trace.
Review Trace Information
Trace information includes: trace measurement parameters, analysis parameters, fiber section information, fiber chain information, and the events list.
Trace Parameter
Measurement parameters and analysis parameters display in the parameter window (Figure 7-18).

text_image
Range : 40.0 km PulseWidth : 300 ns Wavelength : 1550 rum IOR : 1.46660 Scatter Coef. : -52.1 dB Average Time : 00:00:15 End Threshold : 3.000 dB NRefl. Threshold 0.200 dB Refl. Threshold -52.000 dB Samp. Dist: 2.56 mFigure 7-18. Parameters
Fiber Section Information
The distance between marker A and B should be considered as one section of optical fiber (Figure 7-19).
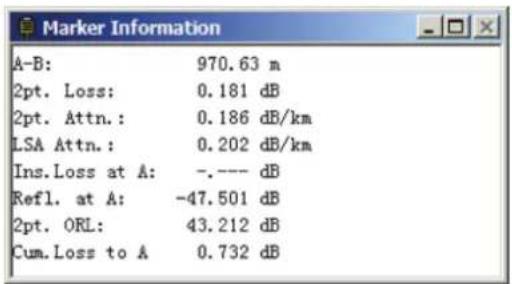
text_image
Marker Information A-B: 970.63 m 2pt. Loss: 0.181 dB 2pt. Attn.: 0.186 dB/km LSA Attn.: 0.202 dB/km Ins.Loss at A: -.--- dB Refl. at A: -47.501 dB 2pt. ORL: 43.212 dB Cum.Loss to A 0.732 dBFigure 7-19. Fiber Section Information
Fiber Chain Information
The distance from beginning to end should be considered as a fiber chain (Figure 7-20).
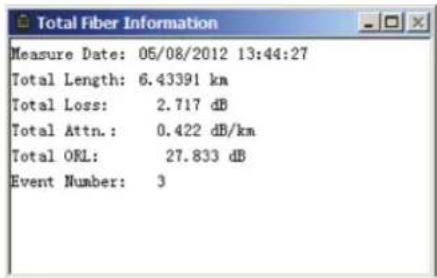
text_image
Measure Date: 05/08/2012 13:44:27 Total Length: 6.43391 km Total Loss: 2.717 dB Total Attn.: 0.422 dB/km Total ORL: 27.833 dB Event Number: 3Figure 7-20. Fiber Chain Information
Review Events List
The trace curve decreases at a fixed slope. Any sudden peak or drop should be considered an event. The 930XC acquires measured data automatically and creates the events list (Figure 7-21).
| No. | Type | Locat... | Ref.[dB] | Ins.Loss[dB] | Attn.[dB/km] | Cum.Loss[... | Dist.Prev.[km] | Dist.End[km] | Loss Prev.[dB] | Comment | |
| 1 | Start | 0.00000 | -46.300 | -.- | -.- | -.- | -.- | 25.29358 | -.- | ||
| 2 | No... | 12.22... | -.- | 0.005 | -0.555 | 4.827 | 12.22389 | 13.06969 | 4.827 | ||
| 3 | End | 25.29... | -23.907 | -.- | 0.191 | 0.000 | 13.06969 | -.- | -4.832 | ||
Figure 7-21. Review Events List
For details relating to the events list, refer to "Events List Window" in this section.
Save Trace
Opened trace files can be saved in the same manner as other files. Click "save trace file" under the "File" menu to save a trace with an existing file name. Click "save as trace file" under the "File" menu to save a trace with a new file name.
ASCII Format Output
Trace Viewer software provides a software interface so that data can be exported in ASCII format and then opened and viewed by a third-party application like MS Excel.
Select "ASCII format output" under the "File" menu (Figure 7-22). Select the information and format, and then press Enter to choose the path and file name.

text_image
Export Options ✓ Trace Info ✓ Meas. Info ✓ Event Table ✓ Trace Data Separator ● Space ○ Comma ○ TAB OK CancelFigure 7-22. ASCII Format
Edit Optical Fiber Information
Select "Edit information of optical fiber" under the "Edit" menu, or click to start editing optical fiber information (Figure 7-23). Information of optical fiber is a description of measurement trace displayed in the trace window. Users input relevant information for efficient management of measurement files. Upon completion of editing, press Enter to confirm.
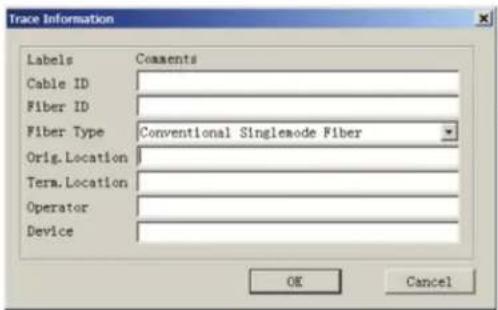
text_image
Trace Information Labels Comments Cable ID Fiber ID Fiber Type Cowentional Singlemode Fiber Orig.Location Term.Location Operator Device OK CancelFigure 7-23. Edit Optical Fiber Information
Revise Events List
Because field measurement situations are constantly changing, the 930XC analysis software cannot guarantee that every analysis is correct. The software provides an interface for users to revise the events list: add event, revise event, delete event, and delete events list.
Add Event
If an event on the measurement trace is not listed in the events list (due to inaccuracies caused by poor SNR or inadequate parameter configuration), use the “add event” function to manually add this event into the events list. Click the events list window, and select “Add event” under the “Editing” menu (Figure 7-24). Choose the type of event from the pull-down menu, enter the event features, and then press Enter to add the event to the events list.
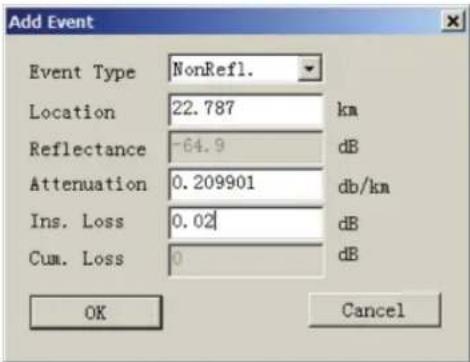
text_image
Add Event Event Type NonRefl. Location 22.787 km Reflectance -64.9 dB Attenuation 0.209901 db/km Ins. Loss 0.02 dB Cum. Loss 0 dB OK CancelFigure 7-24. Add Event
Revise Event
Use the “revise event” function to manually revise features of an event (due to inaccuracies caused by poor SNR or inadequate parameter configuration). Select the event to be revised in the events list window, and select “Revise event” (Figure 7-25). After modifying the event feature(s), press Enter to confirm the changes. The software will automatically refresh the event sequence.
Events can also be revised by clicking on the event to access a pop-up menu.
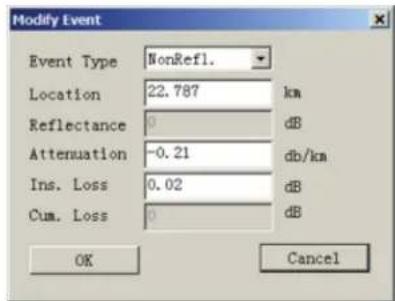
text_image
Modify Event Event Type NonRef1. Location 22.787 km Reflectance 0 dB Attenuation -0.21 db/km Ins. Loss 0.02 dB Cum. Loss 0 dB OK CancelFigure 7-25. Revise Event
Delete Event
Use the “delete event” function to manually delete a trace from the events list when it appears in error (due to inaccuracies caused by poor SNR or inadequate parameter configuration). Highlight the event to be deleted, and then select “Delete event” under the “Editing” menu.
Events can also be deleted by clicking on the event to access a pop-up menu.
Printing
Printing Options
Select "Printing options..." under the "File" menu (Figure 7-26), to select the contents to be printed.
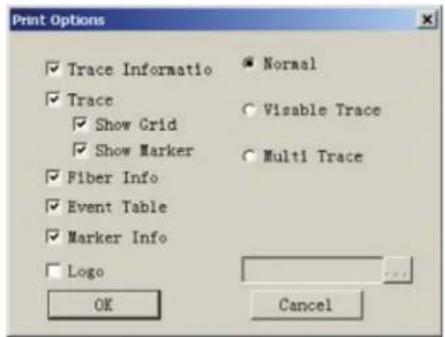
text_image
Print Options ✓ Trace Informatio ✓ Trace ✓ Show Grid ✓ Show Marker ✓ Fiber Info ✓ Event Table ✓ Marker Info ✓ Logo OK Normal Visible Trace Multi Trace CancelFigure 7-26. Printing Options
Printing Setup
Select “Printing setup” under the “File” menu (Figure 7-27) to select the printer, paper size, and printing orientation.
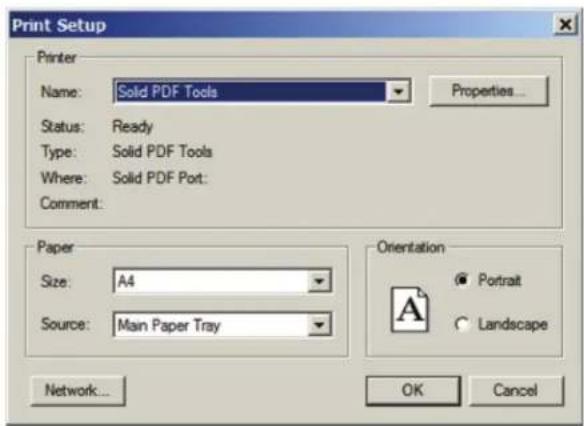
text_image
Print Setup Printer Name: Solid PDF Tools Status: Ready Type: Solid PDF Tools Where: Solid PDF Port: Comment: Paper Size: A4 Source: Main Paper Tray Orientation Portrait Landscape Network... OK CancelFigure 7-27. Printing Setup
Printing Preview
To preview the page before printing, select "Printing preview" under the "File" menu or click on the tool bar (Figure 7-28).
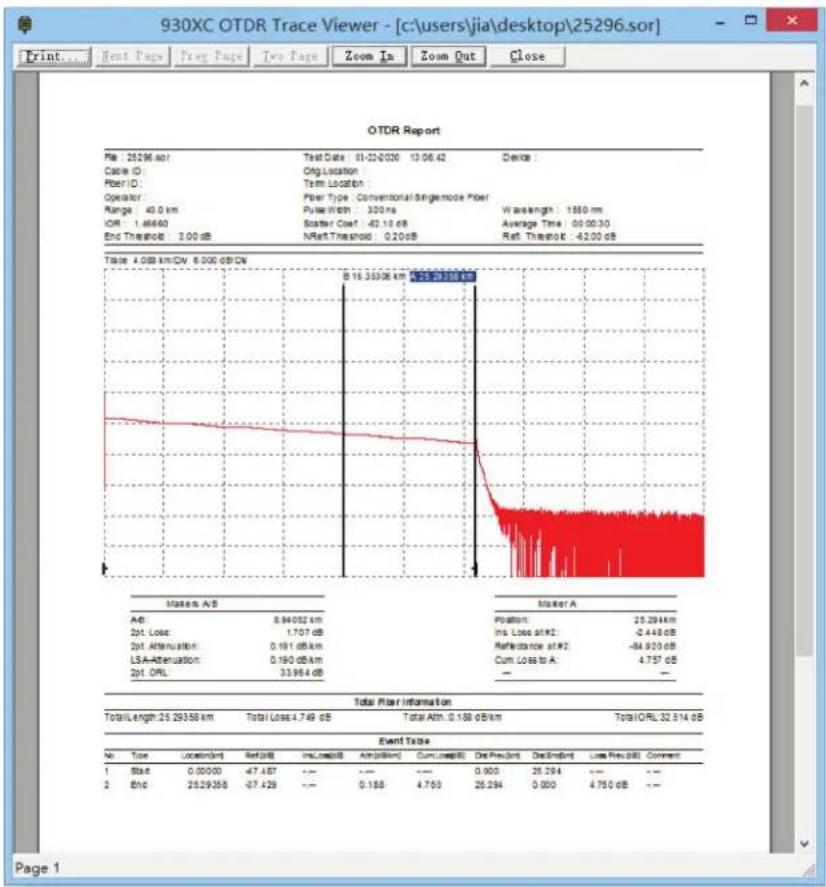
Figure 7-28. Printing Preview
Batch Edit
The 930XC Trace Viewer software has a batch-edit function that allows users to edit the trace information of several trace files in the same folder at one time. Select “Batch Edit” under the “File” menu (Figure 7-30).

text_image
Batch Edit Folder Greemlee 10 HIDScan_3.3 Fcer Downloads example Favorites Adobe Business Linkedin Files in Folder Demo (1), sor Demo (10), sor Demo (11), sor Demo (12), sor Demo (13), sor Demo (14), sor Demo (15), sor Demo (16), sor Demo (2), sor Demo (3), sor Demo (4), sor Demo (5), sor Files to Edit Add All >> Close >> Add >> Add Newer Add Answer All Select to Change Fiber ID Cable ID Fiber Type Orig.Location Term_Location Operator Starting Fiber Number Clear All Text CancelFigure 7-30. Batch Edit
Batch Print
The 930XC Trace Viewer software has a batch-print function that allows users to print several trace files in the same folder at one time. Select "Batch Print" under the "File" menu (Figure 7-31).
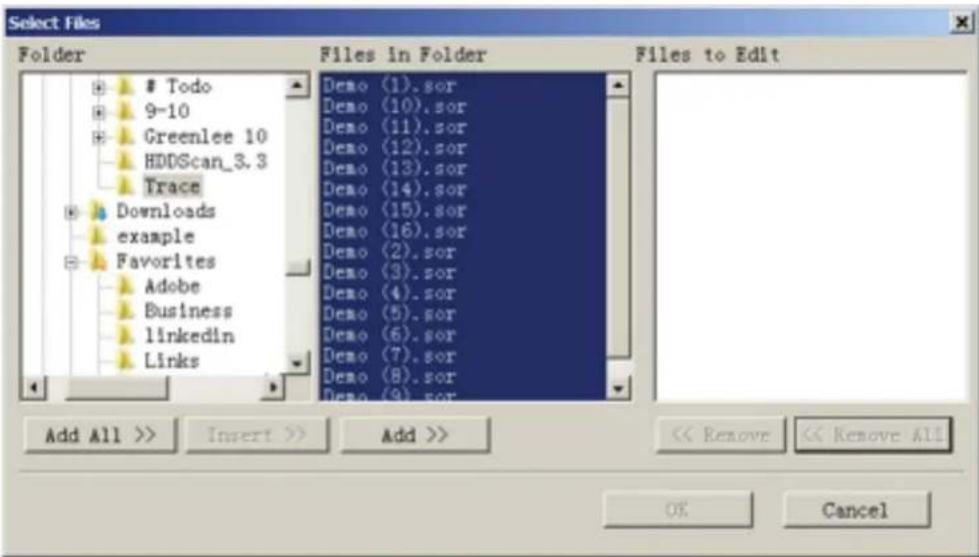
text_image
Select Files FolderTodo
9-10 Greenlee 10 HDDScan_3.3 Trace Downloads example Favorites Adobe Business Linkedin Links Files in Folder Demo (1).sor Demo (10).sor Demo (11).sor Demo (12).sor Demo (13).sor Demo (14).sor Demo (15).sor Demo (16).sor Demo (2).sor Demo (3).sor Demo (4).sor Demo (5).sor Demo (6).sor Demo (7).sor Demo (8).sor Demo (9).sor Files to Edit Add All >> Insert >> Add >> << Remove << Remove All OK CancelFigure 7-31. Batch Print
Batch Print Preview
To preview before batch printing, select "batch print preview" under the "File" menu (Figure 7-32).
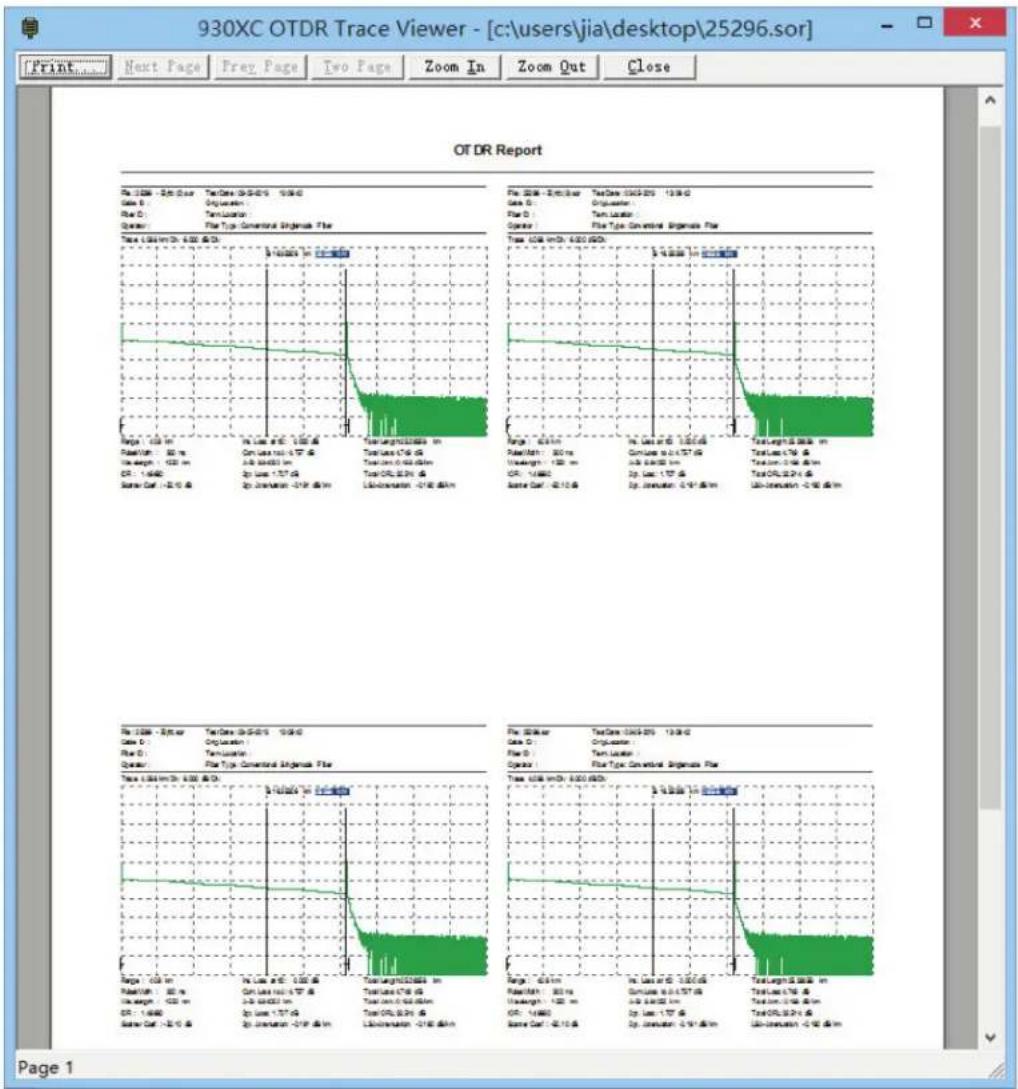
line
| Time (min) | Trace Length (in inches) | |------------|--------------------------| | 0 | 100 | | 1 | 80 | | 2 | 60 | | 3 | 40 | | 4 | 20 | | 5 | 10 | | 6 | 5 | | 7 | 3 | | 8 | 2 | | 9 | 1 | | 10 | 0.5 | | 11 | 0.3 | | 12 | 0.2 | | 13 | 0.1 | | 14 | 0.05 | | 15 | 0.03 | | 16 | 0.02 | | 17 | 0.01 | | 18 | 0.005 | | 19 | 0.003 | | 20 | 0.002 | | 21 | 0.001 | | 22 | 0.0005 | | 23 | 0.0003 | | 24 | 0.0002 | | 25 | 0.0001 | | 26 | 0.00005 | | 27 | 0.00003 | | 28 | 0.00002 | | 29 | 0.00001 | | 30 | 0.000005 | | 31 | 0.000003 | | 32 | 0.000002 | | 33 | 0.000001 | | 34 | 0.0000005 | | 35 | 0.0000003 | | 36 | 0.0000002 | | 37 | 0.0000001 | | 38 | 0.00000005 | | 39 | 0.00000003 | | 40 | 0.00000002 | | 41 | 0.00000001 | | 42 | 0.000000005 | | 43 | 0.000000003 | | 44 | 0.000000002 | | 45 | 0.000000001 | | 46 | 0.0000000005 | | 47 | 99 | | 48 | 98 | | 49 | 97 | | 50 | 96 | | 51 | 95 | | 52 | 94 | | 53 | 93 | | 54 | 92 | | 55 | 91 | | 56 | 90 | | 57 | 89 | | 58 | 88 | | 59 | 87 | | 60 | 86 | | 61 | 85 | | 62 | 84 | | 63 | 83 | | 64 | 82 | | 65 | 81 | | 66 | 80 | | 67 | 79 | | 68 | 78 | | 69 | 77 | | 70 | 76 | | 71 | 75 | | 72 | 74 | | 73 | 73 | | 74 | 72 | | 75 | 71 | | 76 | 70 | | 77 | 69 | | 78 | 68 | | 79 | 67 | | 80 | 66 | | 81 | 65 | | 82 | 64 | | 83 | 63 | | 84 | 62 | | 85 | 61 | | 86 | 60 | | 87 | 59 | | 88 | 58 | | 89 | 57 | | 90 | 56 | | 91 | 55 | | 92 | 54 | | 93 | 53 | | 94 | 52 | | 95 | 51 | | 96 | 50 | | 97 | 49 | | 98 | 48 | | 99 | 47 | | Note: The actual values may vary due to the random nature of the data generation.Figure 7-32. Batch Print Preview
Exit Software
Press "Exit" under the "File" menu (Figure 7-33) to exit the Trace Viewer software.
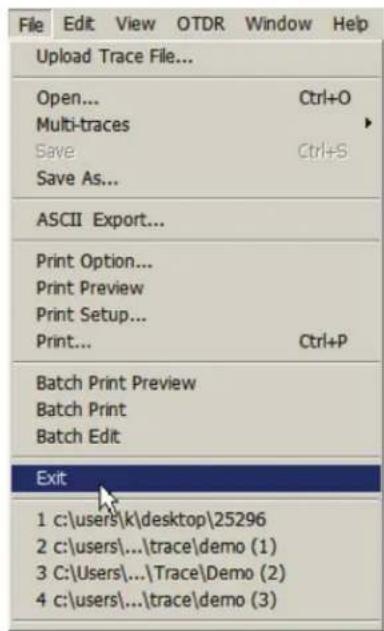
text_image
File Edit View OTDR Window Help Upload Trace File... Open... Ctrl+O Multi-traces Save Ctrl+S Save As... ASCII Export... Print Option... Print Preview Print Setup... Print... Ctrl+P Batch Print Preview Batch Print Batch Edit Exit 1 c:\users\k\desktop\25296 2 c:\users...\trace\demo (1) 3 C:\Users...\Trace\Demo (2) 4 c:\users...\trace\demo (3)Figure 7-33. Exit Software
Tempo Communications
1390 Aspen Way • Vista, CA 92081 • USA
800-642-2155 · An ISO 9001 Company
Tempo Europe Ltd. • Brecon House • William Brown Close
Cwmbran • NP44 3AB, UK • Tel: +44 1633 927 050
www.TempoCom.com