BRUGSANVISNING ATX970S UNIDEN
Uniden®
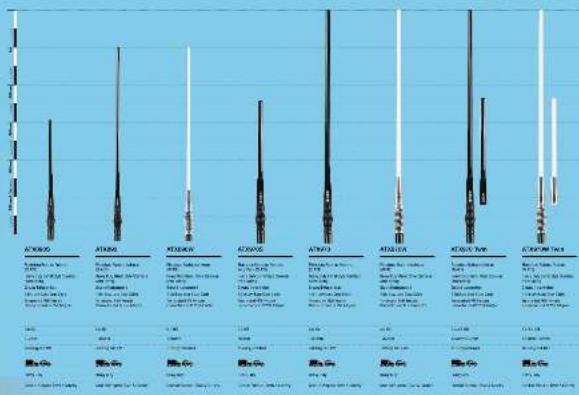
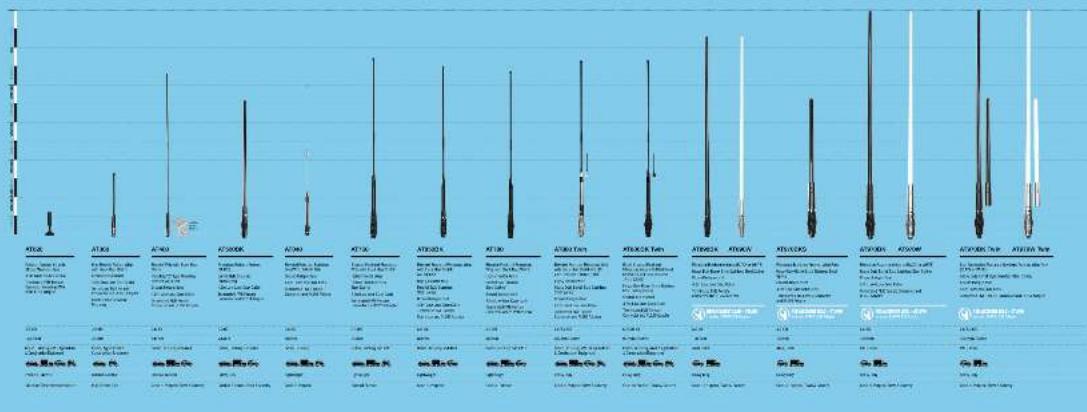
HEAVY DUTY
antenna range
dequary vulana w##d#k#
The following table is provided in the image.
This, an important view is that it will have more time commitments and mind by a way of work as
(2) 本次股东大会的召集、召开符合《公司法》和《公司章程》的规定。
UNIDEN.COM.AU

natural_image
Coastal landscape with a coastal road, hills, and vintage cars (no visible text or symbols)
text_image
ATCOOL
ATMOS
MTCKOW
KONKNE
ATRAO
ATAGUA
KIKKOY KOK
CAPWAL TAKS
100%
100%
100%
100%
100%
100%
100%
100%
100%
100%
100%
100%
100%
100%
100%
100%
100%
100%
100%
100%
100%
100%
100%
100%
100%
100%
Uniden®

text_image
antenna
range
Antenna Range of U.S. States for the 2018-2020
Radar & Radar (Radar & Radar) is a target for the 2018-2020
Radar, an Reropower radar, is based on the 2018-2020
Radar, an Reropower radar, is based on the 2018-2020
UNIDEN.COM.AU
APRUMG
bar
| Procedure | Patient ID | Usage Frequency |
|---|---|---|
| AKI | 100 | 12 |
| AKI | 101 | 14 |
| AKI | 102 | 16 |
| AKI | 103 | 18 |
| AKI | 104 | 20 |
| AKI | 105 | 22 |
| AKI | 106 | 24 |
| AKI | 107 | 26 |
| AKI | 108 | 28 |
| AKI | 109 | 30 |
| AKI | 110 | 32 |
| AKI | 111 | 34 |
| AKI | 112 | 36 |
| AKI | 113 | 38 |
| AKI | 114 | 40 |
| AKI | 115 | 42 |
| AKI | 116 | 44 |
| AKI | 117 | 46 |
| AKI | 118 | 48 |
| AKI | 119 | 50 |
| AKI | 120 | 52 |
| AKI | 121 | 54 |
| AKI | 122 | 56 |
| AKI | 123 | 58 |
| AKI | 124 | 60 |
| AKI | 125 | 62 |
| AKI | 126 | 64 |
| AKI | 127 | 66 |
| AKI | 128 | 68 |
| AKI | 129 | 70 |
| AKI | 130 | 72 |
| AKI | 131 | 74 |
| AKI | 132 | 76 |
| AKI | 133 | 78 |
| AKI | 134 | 80 |
| AKI | 135 | 82 |
| AKI | 136 | 84 |
| AKI | 137 | 86 |
| AKI | 138 | 88 |
| AKI | 139 | 90 |
| AKI | 140 | 92 |
| AKI | 141 | 94 |
| AKI | 142 | 96 |
| AKI | 143 | 98 |
| AKI | 144 | 100 |
| AKI | 145 | 102 |
| AKI | 146 | 104 |
| AKI | 147 | 106 |
| AKI | 148 | 108 |
| AKI | 149 | 110 |
| AKI | 150 | 112 |
| AKI | 151 | 114 |
| AKI | 152 | 116 |
| AKI | 153 | 118 |
| AKI | 154 | 120 |
| AKI | 155 | 122 |
| AKI | 156 | 124 |
| AKI | 157 | 126 |
| AKI | 158 | 128 |
| AKI | 159 | 130 |
| AKI | 160 | 132 |
| AKI | 161 | 134 |
| AKI | 162 | 136 |
| AKI | 163 | 138 |
| AKI | 164 | 140 |
| AKI | 165 | 142 |
| AKI | 166 | 144 |
| AKI | 167 | 146 |
| AKI | 168 | 148 |
| AKI | 169 | 150 |
| AKI | 170 | 152 |
| AKI | 171 | 154 |
| AKI | 172 | 156 |
| AKI | 173 | 158 |
| AKI | 174 | 160 |
| AKI | 175 | 162 |
| AKI | 176 | 164 |
| AKI | 177 | 166 |
| AKI | 178 | 168 |
| AKI | 179 | 170 |
| AKI | 180 | 172 |
| AKI | 181 | 174 |
| AKI | 182 | 176 |
| AKI | 183 | 178 |
| AKI | 184 | 180 |
| AKI | 185 | 182 |
| AKI | 186 | 184 |
| AKI | 187 | 186 |
| AKI | 188 | 188 |
| AKI | 189 | 190 |
| AKI | 190 | 192 |
| AKI | 191 | 194 |
| AKI | 192 | 196 |
| AKI | 193 | 198 |
| AKI | 194 | 200 |
| AKI | 195 | 202 |
| AKI | 196 | 204 |
| AKI | 197 | 206 |
| AKI | 198 | 208 |
| AKI | 199 | 210 |
| AKI | 200 | 212 |
| AKI (with a separate label) - Patients with patients who are not specified in the chart. The chart displays the number of patients associated with each of the three groups (in patients with one or two groups). The data is presented in a grid format with each row representing a patient's group. The values for the number of patients associated with each of the three groups are shown as 'value' in the table below. The numerical value above it represents the average number of patients associated with each of the three groups. The numerical value above it represents the average number of patients associated with each of the three groups. The numerical value above it represents the average number of patients associated with each of the three groups. The numerical value above it represents the average number of patients associated with each of the three groups. The numerical value above it represents the average number of patients associated with each of the three groups. The numerical value above it represents the average number of patients associated with each of the three groups. The numerical value below it represents the average number of patients associated with each of the three groups. The numerical value below it represents the average number of patients associated with each of the three groups. The numerical value below it represents the average number of patients associated with each of the three groups. The numerical value above it represents the average number of patients associated with each of the three groups. The numerical value above it represents the average number of patients associated with each of the three groups. The numerical value above it represents the average number of patients associated with each of the three groups. The numerical value above it represents the average number of patients associated with each of the three groups. The numerical value above it represents the average numbers between two groups (one and two), respectively. The numerical values above each group are displayed on top of each bar.

